

- ADMISSION OPEN FOR NEW BATCH
Advanced Certification in Data Science & Analytics

TIH at IIT Bombay

TIH at IIT Patna

TIH at IIT Palakkad
- Advanced Certification Program from FutureSkills Prime, a joint initiative of NASSCOM and the Ministry of Electronics and Information Technology (MeitY), Government of India.
- Certification Program from Technology Innovation Hub (TIH), IIT Patna (Weekday Batch) and Technology Innovation Hub (TIH), IIT Bombay (Weekend Batch).
- 6-month technical training program with hybrid learning (Online + Classroom).
- Dedicated batches for Freshers and Working Professionals, with customized learning paths tailored to their experience and career goals.
- Working Professionals: Recommended to enroll in the Weekend Batch for better work-life balance.
- Future-ready curriculum designed for the age of ChatGPT, Generative AI, Agentic AI, and AI-powered software development.


- LEAD INSTRUCTOR
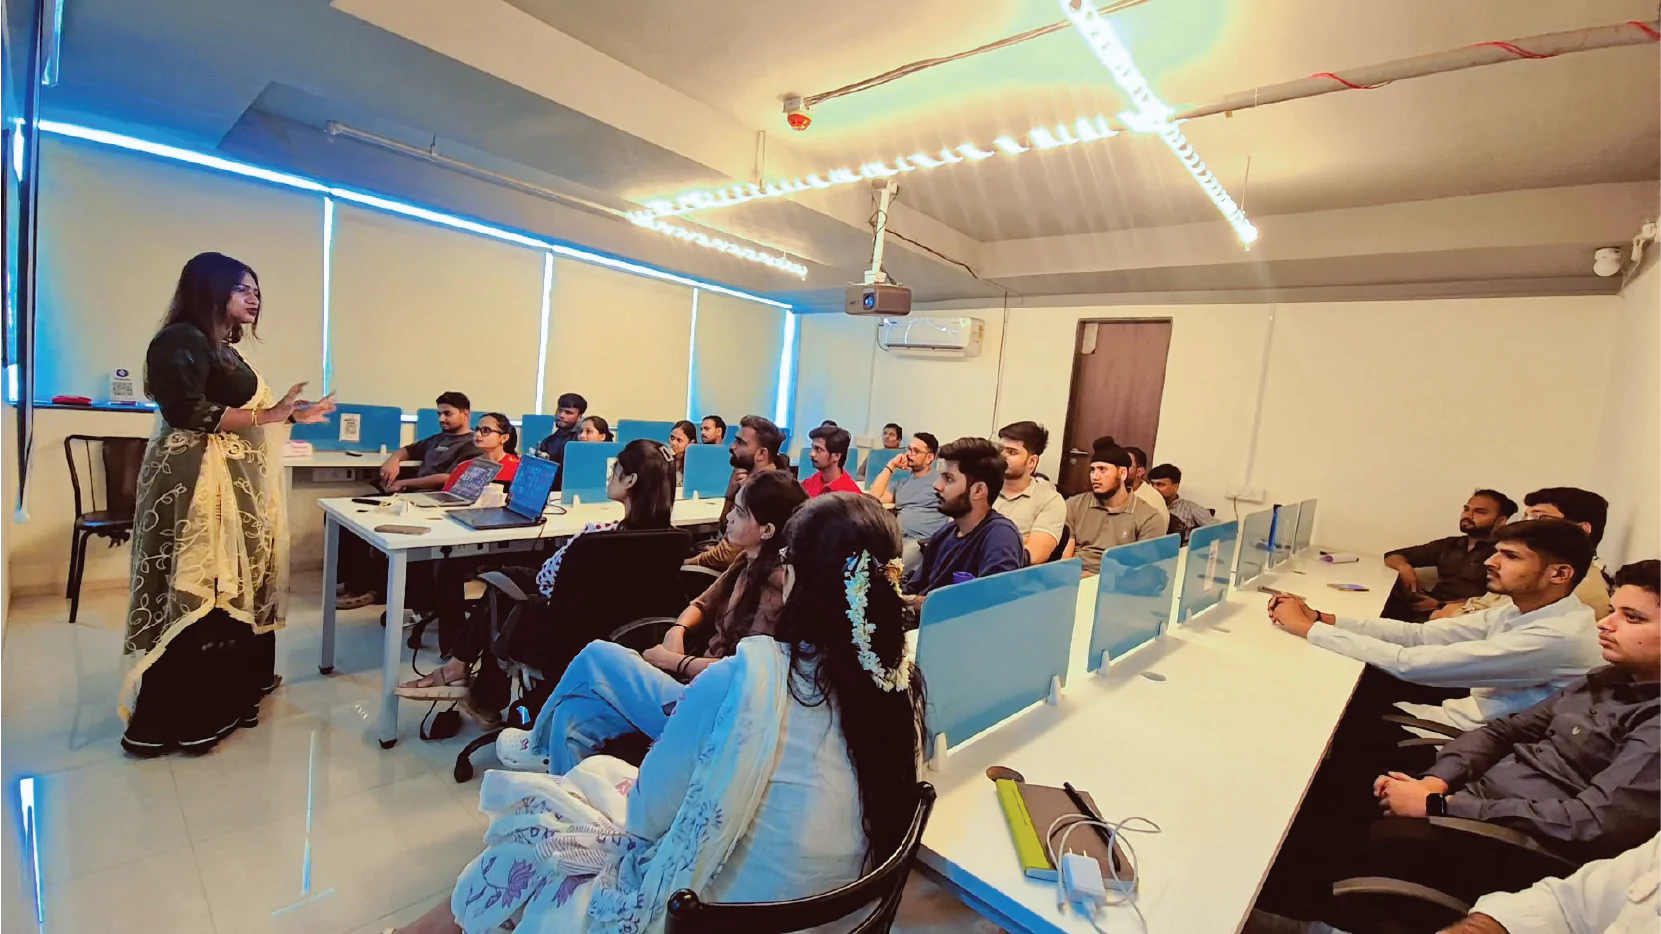
- CLASSROOM TRAINING
Advanced Certification Program in Data Science & Analytics: Build your career in 2026
- Live Training
- AI Skill Roadmap
- Learn from Industry Experts

Next Batch
29th Sep, 2026

Time
08:30 AM - 10:30 AM
- Start your journey into the world of Artificial Intelligence — even if you have zero experience.
- In this live career webinar, industry expert Himanshu Sir(AI & Technology Expert 16+ Years of Industry Experience) will guide you through the exact roadmap to become an AI professional in 2026.
- Discover the essential skills, tools, and real-world projects you need to move from beginner to AI expert and build a high-growth career in the AI industry.
29th Sep, 2026
Next Batch
06 Months
Program Duration
Hybrid
classroom + online
TIH at IIT Bombay
Premier Institute Certification

In Association With :


Mentors & Instructors
Our team is made up of industry experts, seasoned professionals, and passionate trainers who work together as a close-knit family. We believe in not just teaching, but mentoring, inspiring, and growing together — creating a learning environment that feels like home and performs like the best in the business.

Gurjeet Sir
Ex IIT Kharagpur, AI

Sachin Sir
Ex Microsoft – Azure

Vinit Sir
Ex IIT Bombay, GenAI

Jatin Sir
Ex Credit Suisse, Python

Siddhant Sir
Ex IIIT Allahabad, DSA

Raman Sir
Ex-Data Analyst, MuSigma

Anurag Sir
Ex-IIM Bangalore, GenAI

Himanshu Sir
Most Advanced Curriculum in Industry
Introduction to Python & Its Objects
- What is Python?
- History of Python and creator Guido van Rossum
- Why Python is popular
- Applications of Python (Data Science, AI, Web, Automation)
- Python vs other languages
- Writing the first program (Hello World)
- Python syntax basics
- Comments in Python
- Indentation rules
- Variables in Python
- Naming rules
- Basic data types – int, float, str, list, dict, tuple, set, None, Bool
Operators in Python – 1
- Arithmetic operators
- Comparison operators
- Assignment operators
- Membership and identity operators
- Data Handling in int, Str
- Indexing & Slicing in strings
Operators in Python – 2
- Basic operations on list
- Complex List Handling
- Basic operations on tuple
- Complex tuple Handling
- Basic operations on dict
- Complex Dict Handling
Python Built-in functions
- Introduction to Set, None and Bool Objects
- Built-in functions in Python
- input(), len(), type(), abs(), pow(), min(), max(), sum(), range(),enumerate(), zip(), map(), filter(), sorted(), reversed(), all(), any(), id(), help(), dir(), isinstance().
Conditonal Statement in Python
- Introduction to Conditional Statements
- if Statement
- if-else Statement
- if-elif-else Statement
- Nested if Statements
- Comparison Operators in Conditions
- Logical Operators (and, or, not)
- Practical Examples of Conditional Statements
Loops in Python – While
- Introduction to while Loop
- Syntax of while Loop
- Flow of Execution in a while Loop
- Using Conditions in while Loop
- Infinite while Loop
- Using break with while Loop
- Using continue with while Loop
- Using pass in while Loop
- while Loop with else Statement
- Nested while Loops
Loops in Python – for
- Introduction to for Loop
- Syntax of for Loop
- Iterating Over a Sequence
- Using range() with for Loop
- Iterating Over Strings
- Iterating Over Lists, Tuples, and Sets
- Iterating Over Dictionaries
- Nested for Loops
- Using break with for Loop
- Using continue with for Loop
- Using pass with for Loop
- else with for Loop
Comprehension in Python
- Introduction to Comprehensions
- List Comprehension
- Syntax of List Comprehension
- Conditional List Comprehension
- Nested List Comprehension
- Dictionary Comprehension
- Set Comprehension
- Generator Expressions
User Defined Function
- Introduction to User Defined Functions
- Defining a Function using def
- Calling a Function
- Function Parameters and Arguments
- Default Parameters
- Keyword Arguments
- Return Statement
- Multiple Return Values
- Scope of Variables (Local vs Global)
- lambda function
Python object functions
- str – lower(), upper(), strip(), replace(), split(), join(), find(), startswith(), endswith(), count(), capitalize(), title(), swapcase(), isdigit(), isalpha(), isalnum()
- list -m append(), extend(), insert(), remove(), pop(), clear(), index(), count(), sort(), reverse()
- tuple – count(), index()
- dict – keys(), values(), items(), get()
File Handling in Python
- Introduction to File Handling
- Opening a File (open())
- File Modes (r, w, a)
- Reading from a File (read(), readline(), readlines())
- Writing to a File (write(), writelines())
- Closing a File (close())
- Using with Statement for File Handling
- Working with Text Files
Object Oriented Python – 1
- Introduction to Object-Oriented Programming
- Classes and Objects
- Creating a Class & Objects
- __init__() Constructor Method
- Instance Variables and Methods
- Class Variables and Methods
- Encapsulation & Abstraction
Object Oriented Python – 2
- Inheritance
- Method Overriding
- Polymorphism
- Special (Magic/Dunder) Methods
- Exception Handling using try and Except
Python Built in Modules
- Introduction to Python Built-in Modules
- Importing Modules (import, from, as)
- Exploring Modules using dir()
- The math Module
- The datetime Module
- The os Module
- The logging Module
Data Handling with Python (numpy)
- Introduction to NumPy
- Installing and Importing NumPy
- Creating NumPy Arrays
- Array Attributes (shape, size, dtype)
- Indexing and Slicing Arrays
- Array Operations and Arithmetic
- Broadcasting in NumPy
- Reshaping Arrays (reshape(), resize())
- Aggregation Functions (sum(), mean(), min(), max())
- Mathematical Functions in NumPy
- Random Number Generation
- Working with Multi-dimensional Arrays
- Saving and Loading NumPy Arrays
Data Handling with Python (pandas) – 1
- Introduction to Pandas
- Installing and Importing Pandas
- Pandas Series
- Handling Pandas Series
- Pandas DataFrame
- Handling Pandas DataFrane
- Accessing Dataframes
- Reading Data from CSV, Excel, and JSON Files
- Writing Data to Files
Data Handling with Python (pandas) – 2
- Data Selection and Filtering
- Handling Missing Values
- Data Cleaning and Transformation
- Sorting and Ranking Data
- Grouping and Aggregation (groupby())
- Merging and Joining DataFrames
- Basic Data Analysis and Summary Statistics
Data Analysis with Python (matplotlib)
- Introduction to Matplotlib
- Installing and Importing Matplotlib
- Understanding pyplot Module
- Creating Basic Plots
- Line Plot
- Bar Chart
- Histogram
- Scatter Plot
- Pie Chart
- Customizing Plots (Title, Labels, Legends)
- Formatting Axes and Ticks
- Multiple Plots in One Figure
- Subplots
- Grid and Style Customization
Introduction to SQL for Data Analytics – 1
- Primary Key
- Foreign Key
- Relationships
- Schema
- Creating a Database
- Creating a Table
- How SQL Works
- SQL Processing Flow
- SQL Commands
- SQL Command Types
- DQL (Data Query Language)
- DML (Data Manipulation Language)
- DDL (Data Definition Language)
- DCL (Data Control Language)
- TCL (Transaction Control Language)
Building Queries: Core SQL Concepts – 1
- Fundamentals of Building SQL Queries
- Session Details
- Learning Objectives
- SQL Online Compiler
- Create a Table in SQL
- Datatypes in SQL
- Numeric Types
- Character/Text Types
- Date & Time Types
- Boolean Type
- Inserting Data into the Table
- Explanation
Building Queries: Core SQL Concepts – 2
- Creating a Table from an Existing Table
- SQL SELECT Query
- Select Specific Columns
- Select All Columns
- SQL SELECT DISTINCT
- SQL WHERE Clause
- Operators in SQL
- Types of SQL Operators
- Comparison Operators
Working with Multiple Tables & Relationships
- Working with Multiple Tables & Relationships
- Learning Objectives
- Create Two Tables
- Customers Table
- Orders Table
- Table Output
- Relationships Between Tables
- Primary and Foreign Keys
- Real-World Table Connections
SQL Joins
- SQL Joins & Case Statements
- Session Details
- Learning Objectives
- What is a JOIN & Why Do We Need It?
- JOIN Syntax
- Types of SQL Joins
- SQL INNER JOIN
- SQL LEFT JOIN
- SQL RIGHT JOIN
- SQL FULL JOIN
- SQL SELF JOIN
- CASE Statements in SQL
- Practice Section
Data Cleaning & Transformation with SQL
- Data Cleaning & Transformation with SQL
- Session Details
- Learning Objectives
- Understanding Raw Data & Common Data Quality Issues
- Identifying NULLs and Invalid Values
- Handling NULL Values
- Find rows with ANY NULL
- Check NULLs column-by-column
- Using IS NOT NULL
- Fill missing values using COALESCE
- NULLIF() Function in SQL Server
- When Not to Fill NULLs
- Cleaning Text Fields
Type Conversion & Mathematical Operations
- Window Functions & CTEs in SQL
- Session Details
- Learning Objectives
- What is a Window?
- Window Functions in SQL
- Breaking Down the Window Syntax
- PARTITION BY
- ORDER BY
- Types of Window Functions in SQL
- Aggregate Window Functions
- Ranking Window Functions
- Value Functions
Type Conversion & Mathematical Operations (Live Lecture, Quiz, Programming Assignment)
- SQL + Python Integration for Data Analysis
- Session Details
- Learning Objectives
- Why Should We Use SQL + Python Together
- Connecting Python to a SQL Database
- Using a Cursor in SQLite
- Running SQL Queries from Python
- Creating SQLite3 tab
Working with Date, Time & String Functions (Live Lecture, Quiz, Programming Assignment)
- Working with Date, Time & String Functions
- Session Details
- Learning Objectives
- Understanding Real-World Challenges with Dates & Text
- SQL Date and Time Functions
- Common SQL Date & Time Data Types
- NOW()
- CURDATE()
- CURTIME()
- DATE()
- String Functions
- Pattern Matching (LIKE & Wildcards)
Window Functions (Live Lecture, Quiz, Programming Assignment)
- Window Functions in SQL
- Session Details
- Learning Objectives
- What is a Window?
- Window Functions in SQL
- Breaking Down the Window Syntax
- PARTITION BY
- ORDER BY
- Aggregate Window Functions
- Ranking Functions
- Value Functions
Excel
- Advanced Formulas & Functions
- Revision of basic formulas (SUM, IF, VLOOKUP)
- IF with multiple conditions (Nested IF, IFS)
- Logical functions (AND, OR, NOT)
- Lookup functions (VLOOKUP, HLOOKUP, XLOOKUP introduction)
- INDEX & MATCH (better alternative to VLOOKUP)
- Text functions (LEFT, RIGHT, MID, LEN, CONCAT, TRIM)
- Data Management & Data Cleaning
- Sorting & Filtering (Advanced Filter)
- Data Validation (drop-downs, restrictions)
- Remove Duplicates
- Text to Columns
- Flash Fill
- Conditional Formatting (rules, color scales, icons)
- Working with Tables (structured references)
- Practice exercises
- Pivot Tables & Data Analysis
- Creating Pivot Tables
- Pivot Table fields & layout
- Grouping data (dates, numbers)
- Pivot Charts
- Slicers & Timelines
- Calculated fields
- Basic Data Analysis tools (What-if analysis, Goal Seek)
- Practice exercises
- Advanced Tools & Automation
- Introduction to Macros (recording & running)
- Absolute vs Relative referencing in macros
- Basic VBA understanding (optional intro)
- Dashboard creation basics
- Charts (advanced charts, combo charts)
- Protecting sheets/workbooks
- Tips, shortcuts & real-world case study
- Final practice / mini project
PowerBI
- Power BI Overview & Data Connection
- Introduction to Power BI (Desktop, Service, Mobile)
- Data sources (Excel, CSV, SQL, Web) – Import vs DirectQuery
- Power BI interface overview
- Loading and previewing data
- Basic data model introduction
- Practice exercise
- Power Query (Data Transformation)
- Power Query Editor overview
- Data cleaning (remove rows/columns, rename, change data types)
- Handling missing values
- Splitting & merging columns
- Pivot & Unpivot
- Adding custom columns
- Applied steps & query dependencies
- Practice exercise
- Data Modeling
- Relationships (one-to-many, many-to-many)
- Cardinality & cross filter direction
- Star schema vs snowflake schema
- Creating & managing relationships
- Date table creation
- Hierarchies
- Practice exercise
- DAX Fundamentals
- Introduction to DAX
- Calculated columns vs measures
- Basic DAX functions (SUM, COUNT, AVERAGE)
- CALCULATE function
- FILTER function
- Aggregations & simple KPIs
- Practice exercise
- Advanced DAX
- Time intelligence functions (YTD, MTD, SAMEPERIODLASTYEAR)
- ALL, ALLEXCEPT
- Variables in DAX
- Conditional logic (IF, SWITCH)
- Ranking functions
- Performance basics
- Practice exercise
- Data Visualization & Dashboard Design
- Visual types (bar, line, pie, matrix, cards)
- Formatting visuals
- Drill-down & drill-through
- Tooltips
- Slicers & filters
- Page navigation
- Design best practices (UX/UI)
- Practice exercise
- Advanced Features & Power BI Service
- Publishing reports to Power BI Service
- Workspaces & sharing – Row-Level Security (RLS)
- Gateways (intro)
- Scheduled refresh
- Bookmarks & buttons
- App creation
- Practice exercise
- Real-World Project & Optimization
- End-to-end dashboard project
- Data cleaning + modeling + DAX + visuals
- Performance optimization tips
- Best practices for reports
- Common interview questions
- Troubleshooting scenarios
- Final project presentation
Tableau
- Tableau Fundamentals & Data Connection
- Introduction to Tableau ecosystem (Desktop, Server, Public)
- Connecting to data sources (Excel, CSV, SQL)
- Live vs Extract
- Data source page overview
- Dimensions vs Measures
- Basic visualizations (bar, line, pie)
- Show Me panel
- Practice exercise
- Data Preparation & Cleaning
- Data Interpreter
- Sorting & filtering
- Splitting & grouping data
- Pivoting data
- Handling null values
- Creating calculated fields (basic)
- Aliases & default properties
- Practice exercise
- Data Modeling & Joins
- Joins (inner, left, right, full)
- Union
- Relationships vs joins
- Blending data
- Cross
- database joins
- Data source filters
- Extract vs live performance considerations
- Practice exercise
- Calculations (Intermediate)
- Calculated fields deep dive
- Aggregate vs non-aggregate functions
- String, date, and logical functions
- Table calculations (running total, percent of total)
- Quick table calculations
- Practice exercise
- Advanced Calculations
- Level of Detail (LOD) expressions (FIXED, INCLUDE, EXCLUDE)
- Nested calculations
- Conditional calculations
- Ranking & window functions
- Cohort analysis basics
- Practice exercise
- Advanced Visualizations
- Dual axis charts
- Combo charts
- Maps (symbol, filled maps)
- Highlight tables & heatmaps
- Parameters (dynamic control)
Introduction to Statistics & Data
- What is Statistics? Why it matters in Data Science
- Types of Statistics: Descriptive vs Inferential
- Types of Data: Qualitative vs Quantitative
- Levels of Measurement: Nominal, Ordinal, Interval, Ratio
- Population vs Sample — key differences
- Variables: Independent, Dependent, Confounding
- Overview of tools: Python (NumPy, Pandas, SciPy)
Descriptive Statistics – Measures of Central Tendency
- Mean: Definition, formula and calculation
- Median: Definition, formula and when to use it
- Mode: Definition and use cases
- Weighted Mean
- When to use Mean vs Median vs Mode
- Effect of outliers on central tendency
- Calculating Mean, Median, Mode using Python (NumPy & SciPy)
Descriptive Statistics – Measures of Spread & Shape
- Range and its limitations
- Variance and Standard Deviation: Formula and intuition
- Interquartile Range (IQR) and the Five-Number Summary
- Coefficient of Variation
- Skewness: Left-skewed vs Right-skewed distributions
- Kurtosis: Understanding the tail behavior
- Computing spread and shape metrics using Python
Data Visualization for Statistics
- Why visualize data before analyzing?
- Histogram: Understanding data distribution
- Box Plot: Visualizing spread, IQR and outliers
- Bar Chart and Pie Chart for categorical data
- Scatter Plot: Spotting relationships between variables
- Heatmaps for correlation overview
- Using Matplotlib and Seaborn — hands-on with real dataset
Introduction to Probability
- What is Probability? Intuition and formal definition
- Basic Terminology: Experiment, Outcome, Event, Sample Space
- Classical vs Empirical vs Subjective Probability
- Complement Rule
- Addition Rule (mutually exclusive and non-exclusive events)
- Multiplication Rule (independent and dependent events)
- Practical examples with coin, dice and cards
Conditional Probability & Bayes’ Theorem
- Conditional Probability: P(A|B) — definition and formula
- Independent vs Dependent Events
- Law of Total Probability
- Bayes’ Theorem: Formula and step-by-step derivation
- Intuitive understanding with a medical test example
- DS use cases: Spam Filters, Naive Bayes Classifier
- Solving Bayes’ Theorem problems in Python
Probability Distributions – Discrete
- What is a Probability Distribution? PMF and CDF
- Bernoulli Distribution
- Binomial Distribution: Formula, parameters and examples
- Poisson Distribution: Counting events over time/space
- Expected Value and Variance of discrete distributions
- Plotting discrete distributions using Python (SciPy, Matplotlib)
- Practical examples: predicting counts and binary outcomes
Probability Distributions – Continuous
- PDF vs PMF — key difference
- Uniform Distribution
- Normal (Gaussian) Distribution: Shape, parameters and properties
- The 68-95-99.7 Rule (Empirical Rule)
- Standard Normal Distribution and Z-scores
- Exponential Distribution and its DS applications
- Plotting and working with continuous distributions in Python
Sampling & Central Limit Theorem
- What is Sampling? Why not use the whole population?
- Random, Stratified, Systematic and Cluster Sampling
- Sampling Error and Bias
- Sampling Distribution of the Mean
- Central Limit Theorem (CLT): Statement and intuition
- Why CLT is the backbone of inferential statistics
- Simulating CLT using Python (NumPy)
Confidence Intervals & Estimation
- Point Estimate vs Interval Estimate
- What is a Confidence Interval? Interpreting 95% CI correctly
- Margin of Error
- Z-interval: CI when population std is known
- t-interval: CI when population std is unknown
- Effect of sample size on confidence interval width
- Calculating Confidence Intervals in Python (SciPy)
Hypothesis Testing & Statistical Tests
- What is Hypothesis Testing? Steps and framework
- Null Hypothesis (H0) and Alternate Hypothesis (H1)
- Type I Error (False Positive) and Type II Error (False Negative)
- p-value, Significance Level (alpha) and decision rules
- One-tailed vs Two-tailed Tests
- Z-test, One-sample t-test, Independent t-test, Paired t-test
- Chi-Square Test for categorical data independence
- Performing all tests in Python (SciPy.stats) with real examples
Correlation & Capstone Practice
- Covariance: Definition, formula and interpretation
- Pearson Correlation Coefficient
- Spearman Rank Correlation (for non-linear relationships)
- Correlation vs Causation — a critical distinction for DS
- Visualizing correlation matrices using Seaborn Heatmaps
- End-to-end capstone: EDA + descriptive stats + distributions + hypothesis testing + correlation
- Communicating statistical findings clearly to non-technical audiences
Machine Learing
Introduction to Machine Learning
- What is ML? Difference between AI, ML and Deep Learning
- Types of ML: Supervised, Unsupervised
- ML Workflow: Data → Train → Evaluate → Predict
- Key terms: Features, Labels, Training set, Test set
- Overfitting vs Underfitting — visual intuition
Data Preprocessing & Feature Engineering
- Handling missing values: drop vs mean/median/mode imputation
- Encoding categoricals: Label Encoding and One-Hot Encoding
- Feature Scaling: MinMax Normalization vs Standardization
- Train-Test Split and why shuffling matters
- Hands-on: Build a full preprocessing pipeline in scikit-learn
Regression – Linear & Multiple
- What is Regression? Predicting continuous values
- Simple Linear Regression: equation, slope and intercept
- Multiple Linear Regression: using multiple features
- Evaluation metrics: MAE, RMSE, R-squared
- Hands-on: Train and evaluate a Linear Regression model
Regression – Polynomial & Regularization
- Polynomial Regression: fitting curves to non-linear data
- Problem of overfitting with high-degree polynomials
- Ridge Regression (L2): shrinking large coefficients
- Lasso Regression (L1): coefficient shrinkage + feature selection
- Hands-on: Compare Linear vs Ridge vs Lasso on the same dataset
Classification – Logistic Regression
- What is Classification? Binary vs Multi-class problems
- Logistic Regression: Sigmoid function and decision boundary
- Confusion Matrix: TP, TN, FP, FN explained
- Evaluation metrics: Accuracy, Precision, Recall, F1-Score
- Hands-on: Binary and multi-class classification with Logistic Regression
Classification – KNN & Naive Bayes
- K-Nearest Neighbours (KNN): distance-based prediction intuition
- Choosing the right K with cross-validation
- Naive Bayes: applying Bayes’ theorem to classification
- Gaussian vs Multinomial Naive Bayes — when to use each
- Hands-on: KNN vs Naive Bayes comparison on same dataset
Classification – SVM
- Support Vector Machine: hyperplane and margin concept
- Hard Margin vs Soft Margin SVM
- Kernel Trick: Linear, RBF and Polynomial kernels (intuition)
- SVM for multi-class classification
- Hands-on: SVM with different kernels — compare decision boundaries
Classification – Decision Trees & Random Forest
- Decision Tree: splitting criteria — Gini Impurity and Information Gain
- Visualising a trained Decision Tree
- Overfitting in trees and pruning concept
- Random Forest: ensemble of trees and feature importance
Hands-on: Decision Tree vs Random Forest — accuracy and feature importance
Clustering – K-Means
- What is Clustering? Unsupervised learning use cases
- K-Means algorithm: initialise → assign → update → repeat
- Choosing K: Elbow Method and Inertia
- Limitations of K-Means: outliers and non-spherical clusters
- Hands-on: K-Means clustering with scatter plot visualisation
Clustering – Hierarchical & DBSCAN
- Hierarchical Clustering: Agglomerative approach step-by-step
- Dendrogram: reading and cutting to select cluster count
- DBSCAN: Core, Border and Noise points concept
- When to use DBSCAN vs K-Means vs Hierarchical
- Hands-on: Compare all three clustering methods on one dataset
Dimensionality Reduction – PCA
- Curse of Dimensionality: why too many features hurt models
- Principal Component Analysis (PCA): intuition and purpose
- Explained Variance Ratio: choosing number of components
- Applying PCA before classification and clustering
- Hands-on: PCA on a high-dimensional dataset — visualise in 2D
Model Evaluation & Hyperparameter Tuning
- K-Fold and Stratified K-Fold Cross Validation
- ROC Curve and AUC Score for classifier comparison
- Handling class imbalance: class_weight parameter
- Hyperparameter tuning with GridSearchCV
- Hands-on: Full model selection pipeline — tune, validate and compare
DL-AI
Introduction to Neural Networks
- Biological neuron vs Artificial neuron analogy
Perceptron: inputs, weights, bias and activation
Limitation of single Perceptron — XOR problem
Multi-Layer Perceptron (MLP): hidden layers intuition
Activation functions: Sigmoid, Tanh, ReLU — when to use which
- Biological neuron vs Artificial neuron analogy
ANN Architecture & Forward Propagation
- ANN layers: Input, Hidden and Output
- Weights, Biases and forward pass walkthrough
- Output activations: Sigmoid (binary), Softmax (multi-class)
- Loss Functions: MSE for regression, Cross-Entropy for classification
- Hands-on: Build and run a forward pass using Keras Sequential API
Training an ANN – Backpropagation & Optimizers
- Gradient Descent: rolling downhill analogy
- Backpropagation: how errors flow backwards (concept only)
- Learning Rate: effect of too high vs too low
- Optimizers: SGD, Adam — intuition and practical difference
- Hands-on: Train an ANN and read training vs validation loss curves
ANN Regularization & Applied Tasks
- Overfitting in ANNs: signs from loss curves
- Dropout: randomly disabling neurons during training
- Early Stopping: halt when validation loss stops improving
- ANN for Classification and Regression — architecture differences
- Hands-on: Add Dropout + Early Stopping; save and reload model
NLP
NLP – Text Preprocessing
- What is NLP? Real-world applications overview
- Text cleaning: lowercase, remove punctuation and noise
- Tokenization: word and sentence tokenization with NLTK
- Stop Word Removal
- Hands-on: Build a reusable text cleaning pipeline in Python
NLP – Stemming, Lemmatization & POS Tagging
- Stemming: PorterStemmer — reducing words to root form
- Lemmatization: WordNetLemmatizer — linguistically correct roots
- Stemming vs Lemmatization — when to use which
- POS Tagging: labelling Nouns, Verbs, Adjectives with NLTK
- Named Entity Recognition (NER): extracting people, places and orgs with spaCy
NLP – Text Representation (BoW & TF-IDF)
- Why machines need numbers — text to vectors
- Bag of Words (BoW): vocabulary, sparse matrix concept
- CountVectorizer in scikit-learn
- TF-IDF: rewarding rare important words, penalising common ones
- Hands-on: Build BoW and TF-IDF matrices and compare them
NLP – Sentiment Analysis & Text Classification
- Sentiment Analysis: Positive, Negative, Neutral
- Rule-based approach: VADER sentiment analyser
- ML-based approach: Logistic Regression on TF-IDF features
- Evaluation: Accuracy, Precision, Recall, F1 for text tasks
- Hands-on: Sentiment classifier on a real product reviews dataset
Unlock ₹20,000+ Worth of Premium Bonuses — 100% Free!
Join Any Data/AI Mentorship Program Today and Get Exclusive Learning Perks at Zero Cost!


Best Tech Tools










Industry Projects
Project 01
Retail Analytics for Milan (Italian) Store
Project 02
Pricing Strategy Modeling for a New US Automobile Brand
Project 03
A Deep Learning approach to identify Patterns in Healthcare
Project 04
Using Tableau, PowerBI, ML and DL
The program includes a total of 8 academic projects carefully integrated within the core modules to reinforce learning through practical application.
Trusted by Leading Platforms

Top-Rated Institute

Featured for Excellence

Proud member

Academic Partner

Data Science & Analytics – Program Highlights
- 06+ POCs & Projects – Work on proof-of-concepts and projects to build practical expertise.
- Internship Integrated Program in Data Science & Analytics — a unique blend of training and real time.
- Core concepts like stats, Python, machine learning, deep learning, and analytics, designed to meet real-world demands.
- Tied-Up with 500+ Companies – Get access to top recruiters for exciting job opportunities.
- We help you get hired. With our 100% Career Support, you gain access to POD unique hiring platform.
- Learn to build compelling dashboards and visualizations using Power BI, Tableau, and Matplotlib.
- Job Readiness Program – Master industry skills, resume building, and interview preparation for career success.
- Recognized certification and dedicated placement support designed to launch your career in Data Science & Analytics
- Receive industry-recognized certification and 100% placement support, including resume building, mock interviews.
Up-Skill with 4-in-1 Certifications
Gain a competitive edge in the job market with our exclusive 4-in-1 certification bundle designed to validate your skills and elevate your resume

TIH at IIT Bombay
Recognized certification from TIH at IIT Bombay, adding strong credibility and value to your resume.
Industry Relevant Skills
Demonstrates practical knowledge and industry-relevant skills aligned with modern technologies and real-world applications.
Continuous Learning and Enhances Career Opportunities
Reflects commitment to continuous learning and enhances career opportunities in tech and innovation-driven fields.

Government-Recognized Certification
Earn a prestigious certification jointly endorsed by FutureSkills Prime and MeitY, ensuring strong credibility and national-level recognition.
Skill-Focused Digital Careers Framework
Learn through a curriculum aligned with India’s future digital workforce standards, designed to build job-ready technical expertise.
Verified & Shareable Credential
Add the MeitY-recognized certificate to your LinkedIn, resume, and professional profiles for enhanced employer visibility.

Validated Certification from Ethans Tech
Receive a professional certificate that validates your expertise and is recognized across leading IT companies.
Training Backed by Real-World Expertise
Ethans Tech follows a practical, hands-on training approach aligned with industry needs, boosting your job readiness.
Professional Credential for Career Growth
Showcase your technical skills with a credible certificate that strengthens your portfolio and improves hiring prospects.

Internship Certificate by Nexgen Analytix
Gain an official internship certificate showcasing your practical experience and real-time project exposure.
Verified Industry Internship Recognition
Highlight your applied skills, teamwork, and domain knowledge through a certificate trusted by employers.
Career-Boosting Professional Doc
Add the internship certificate to your resume and LinkedIn to demonstrate hands-on experience and industry exposure.
Master 12+ In-demand Skills
- Python Foundation
- Python Advanced
- Python for Analytics
- Exploratory Data Analysis
- Descriptive Statistics
- Inferential Statistics
- Microsoft Excel
- Microsoft PowerBI
- Tableau
- Database - SQL
- Machine Learning
- Artificial Intelligence
Why to Join this Program
Guest Lectures by IIT professors
Learn directly from top IIT faculty through hands-on, real-time sessions
Ethan’s Tech Career Track
Flexible timelines to complete your course and projects at your own pace
IIT Approved Mentors
Get personalized guidance and career insights from experienced professionals
Advance Curriculum
Master concepts from basic to expert level through structured, applied learning
4.7

4.6

4.5

What Our Learners are Saying
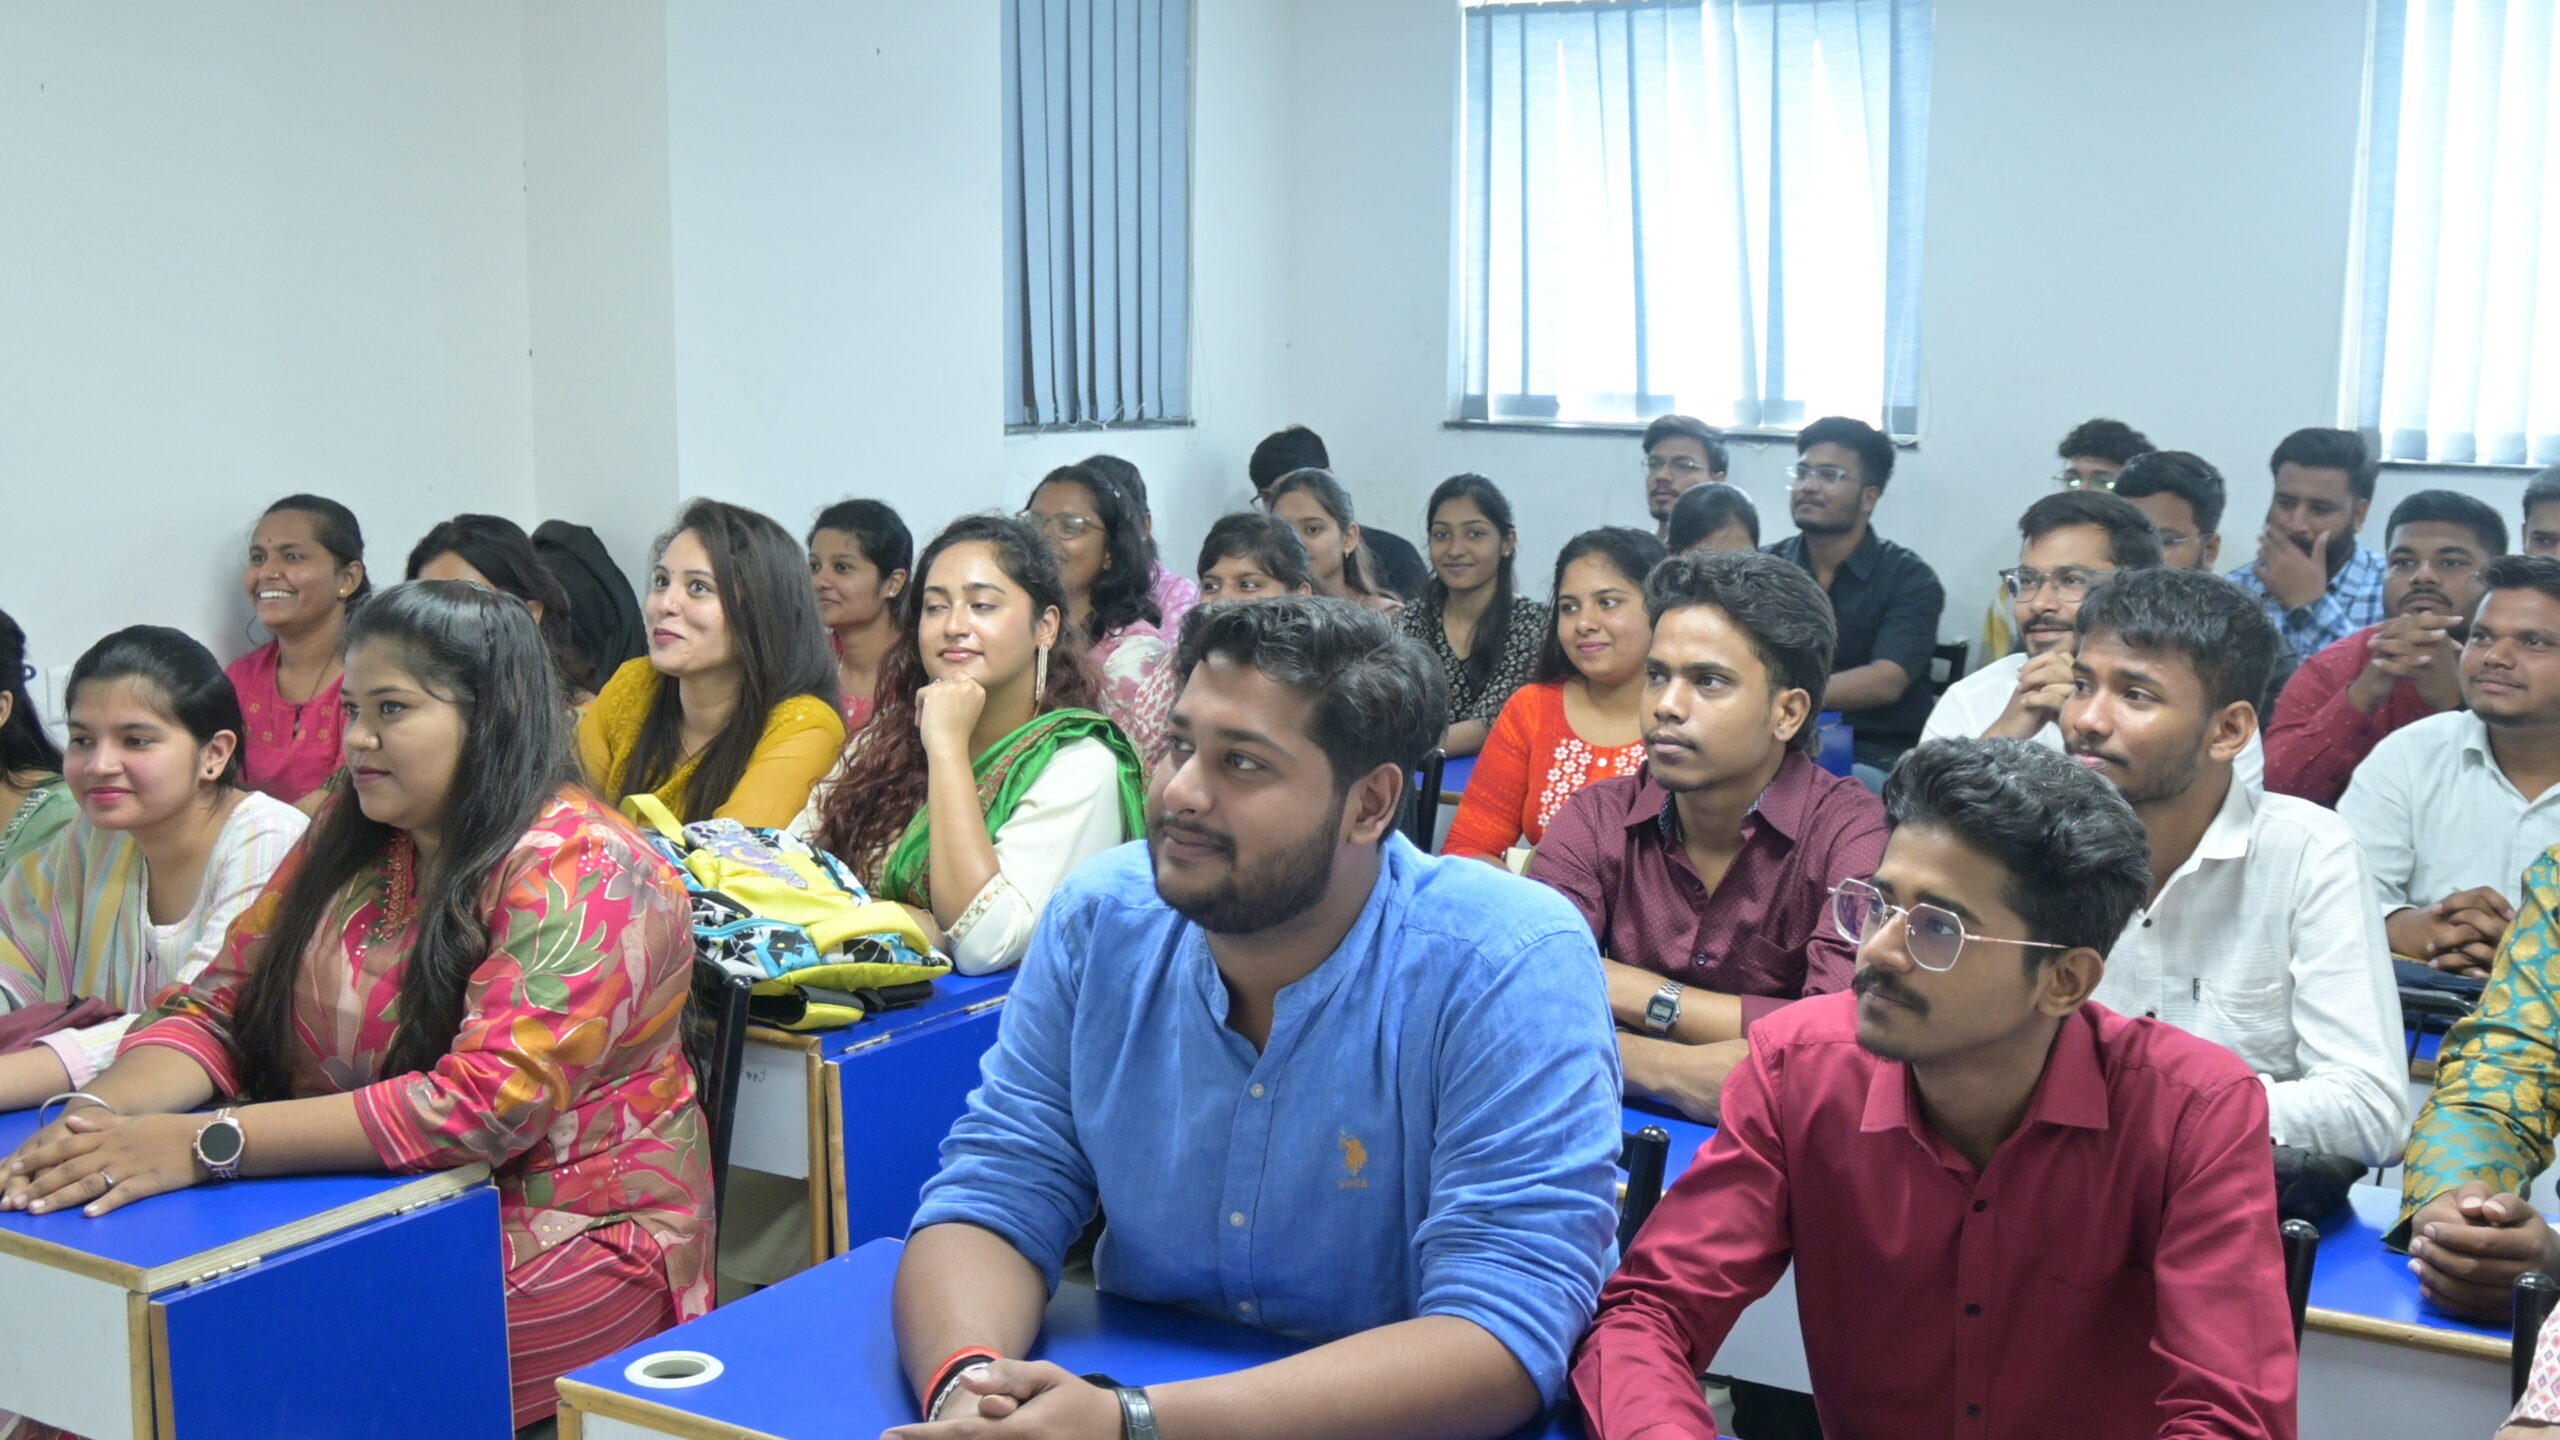
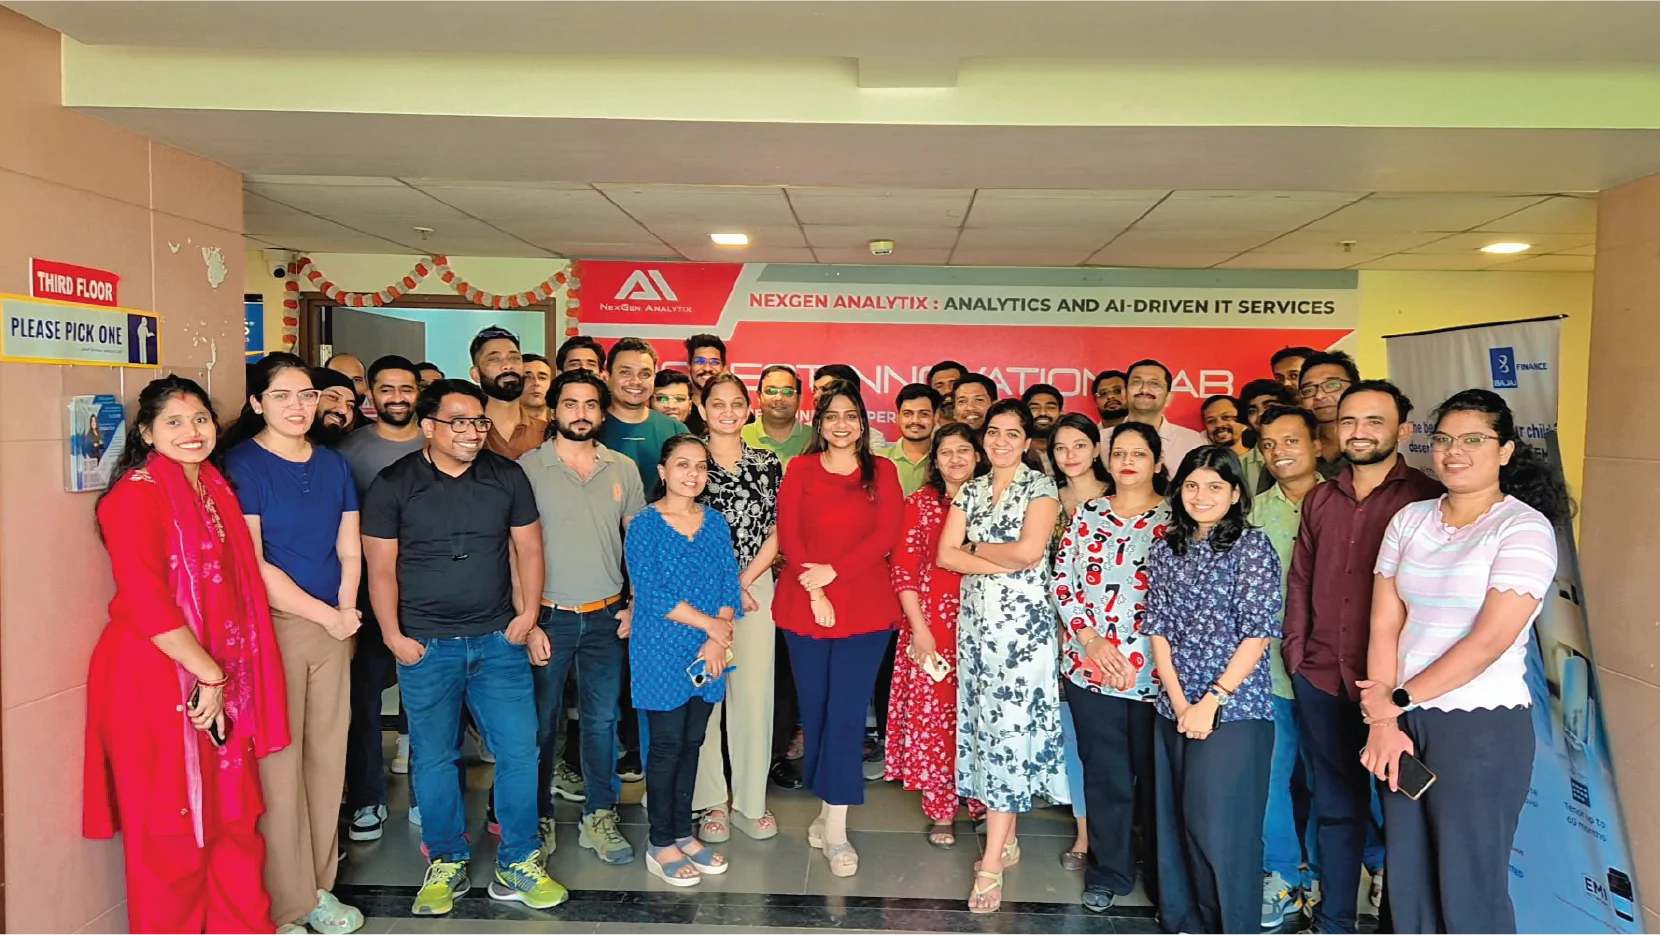
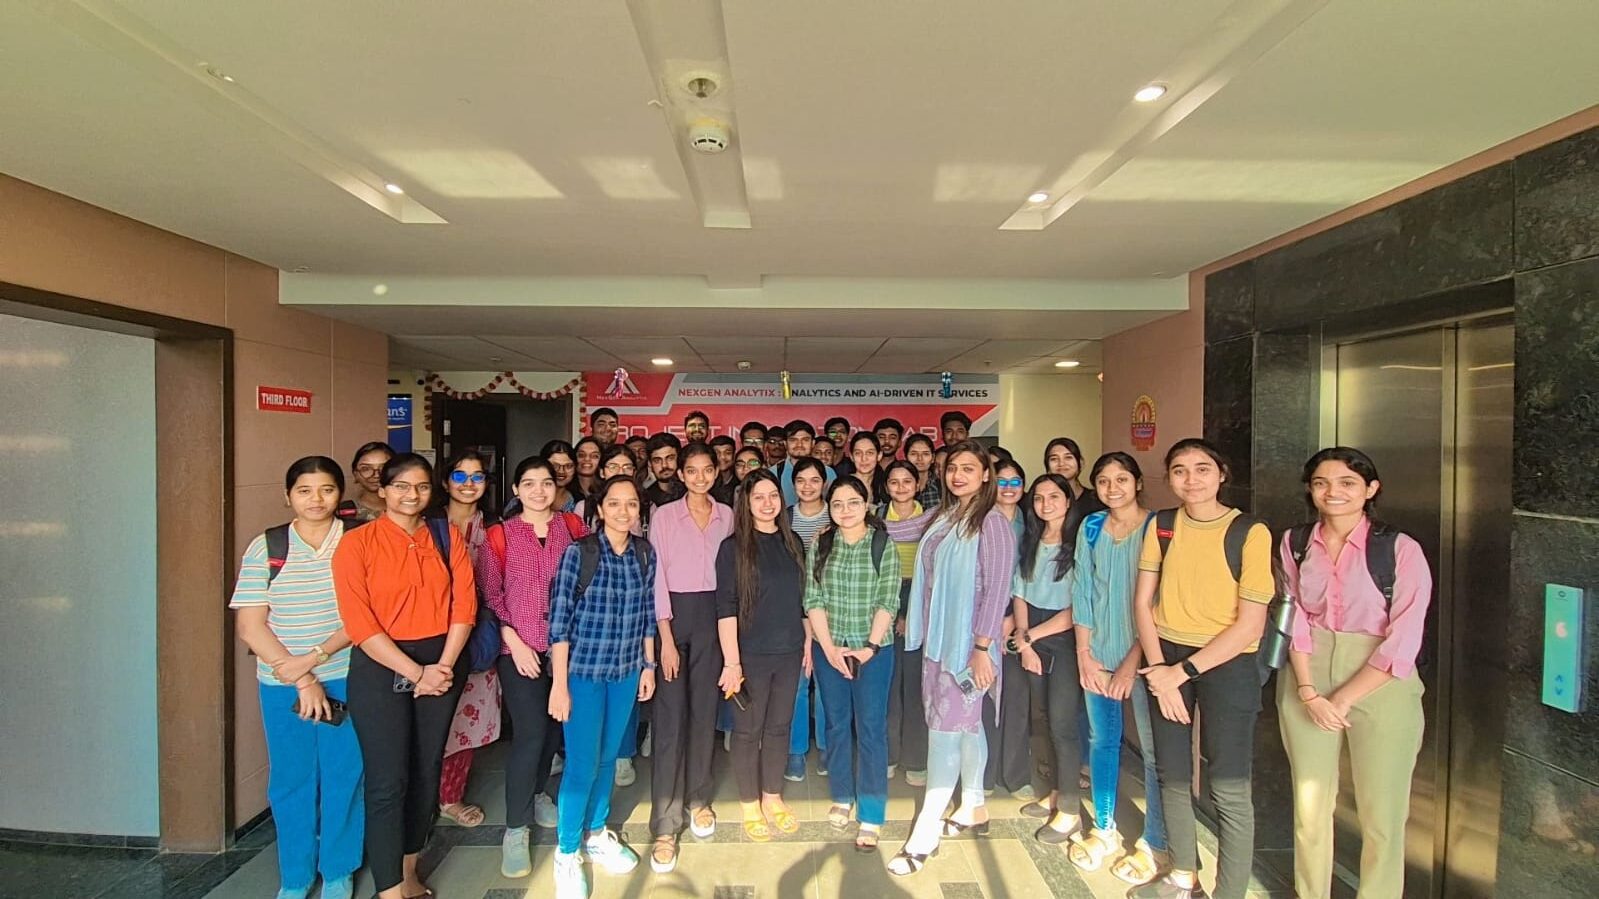
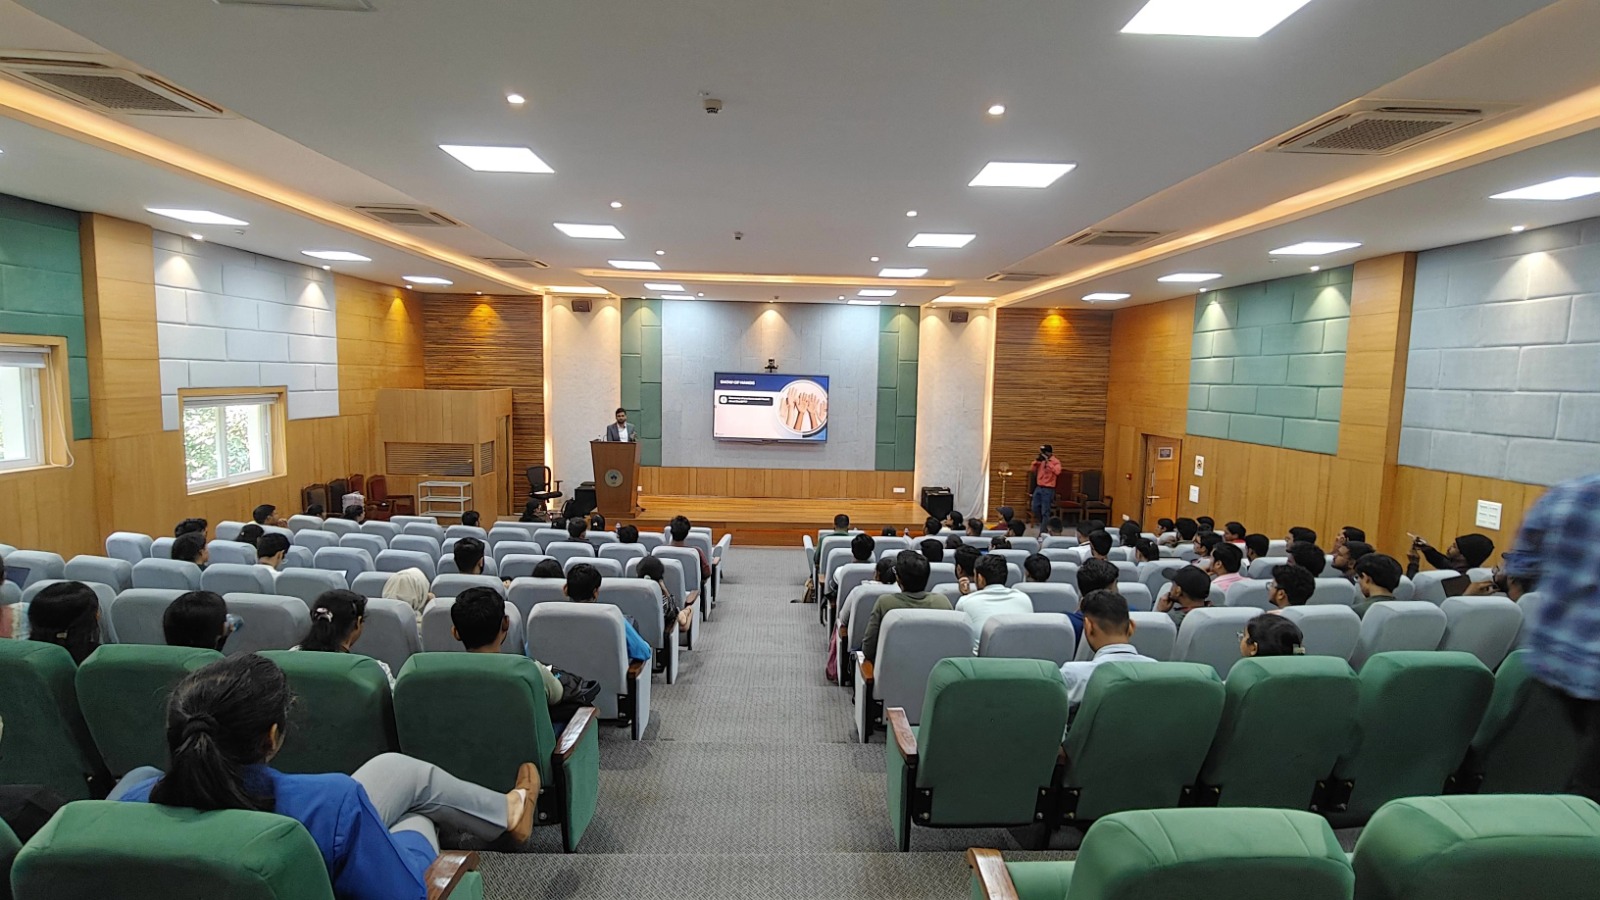
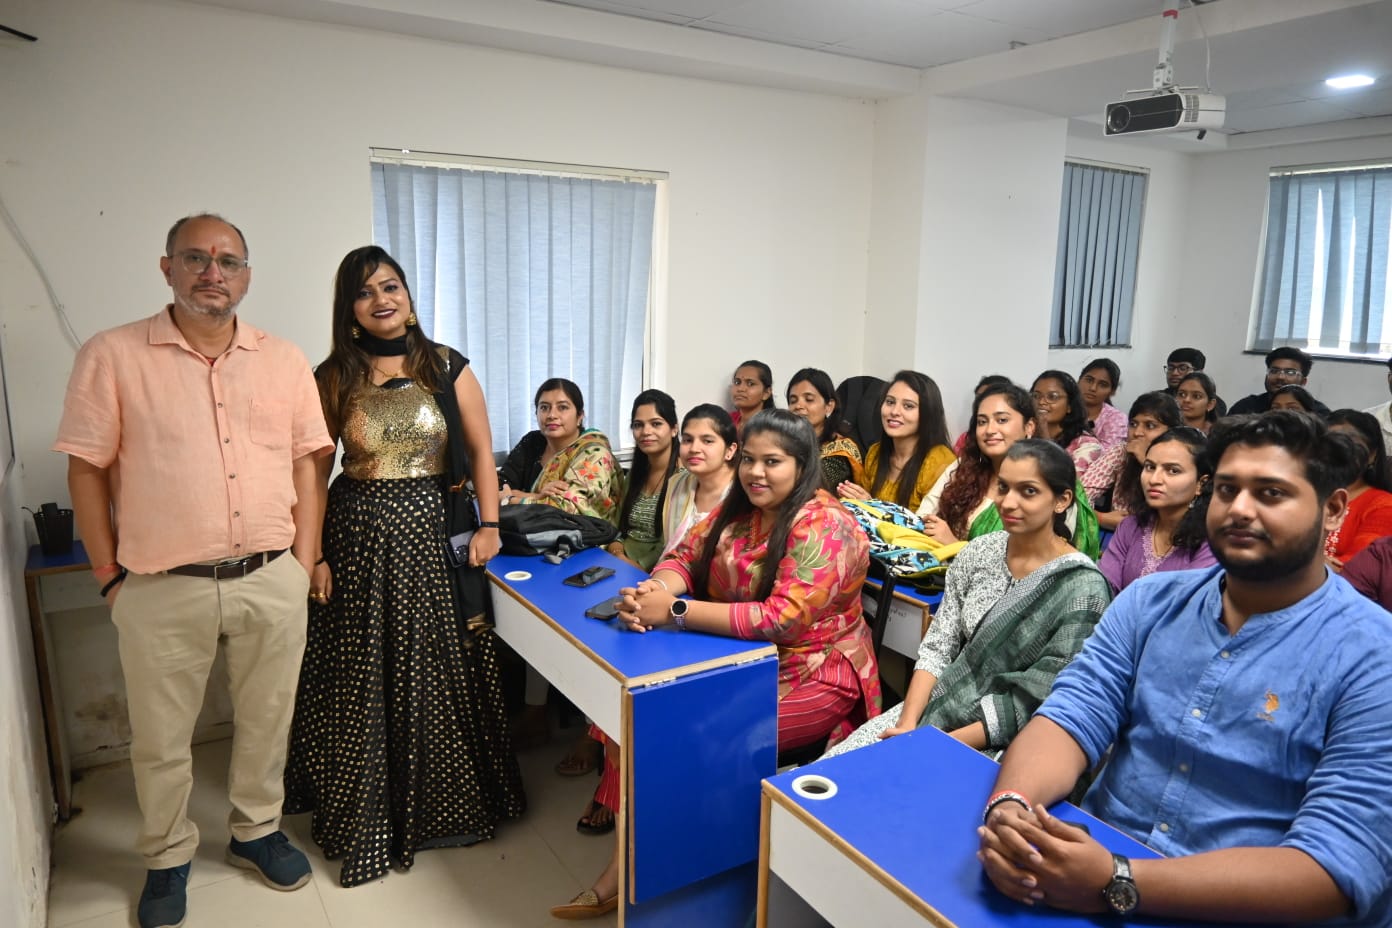
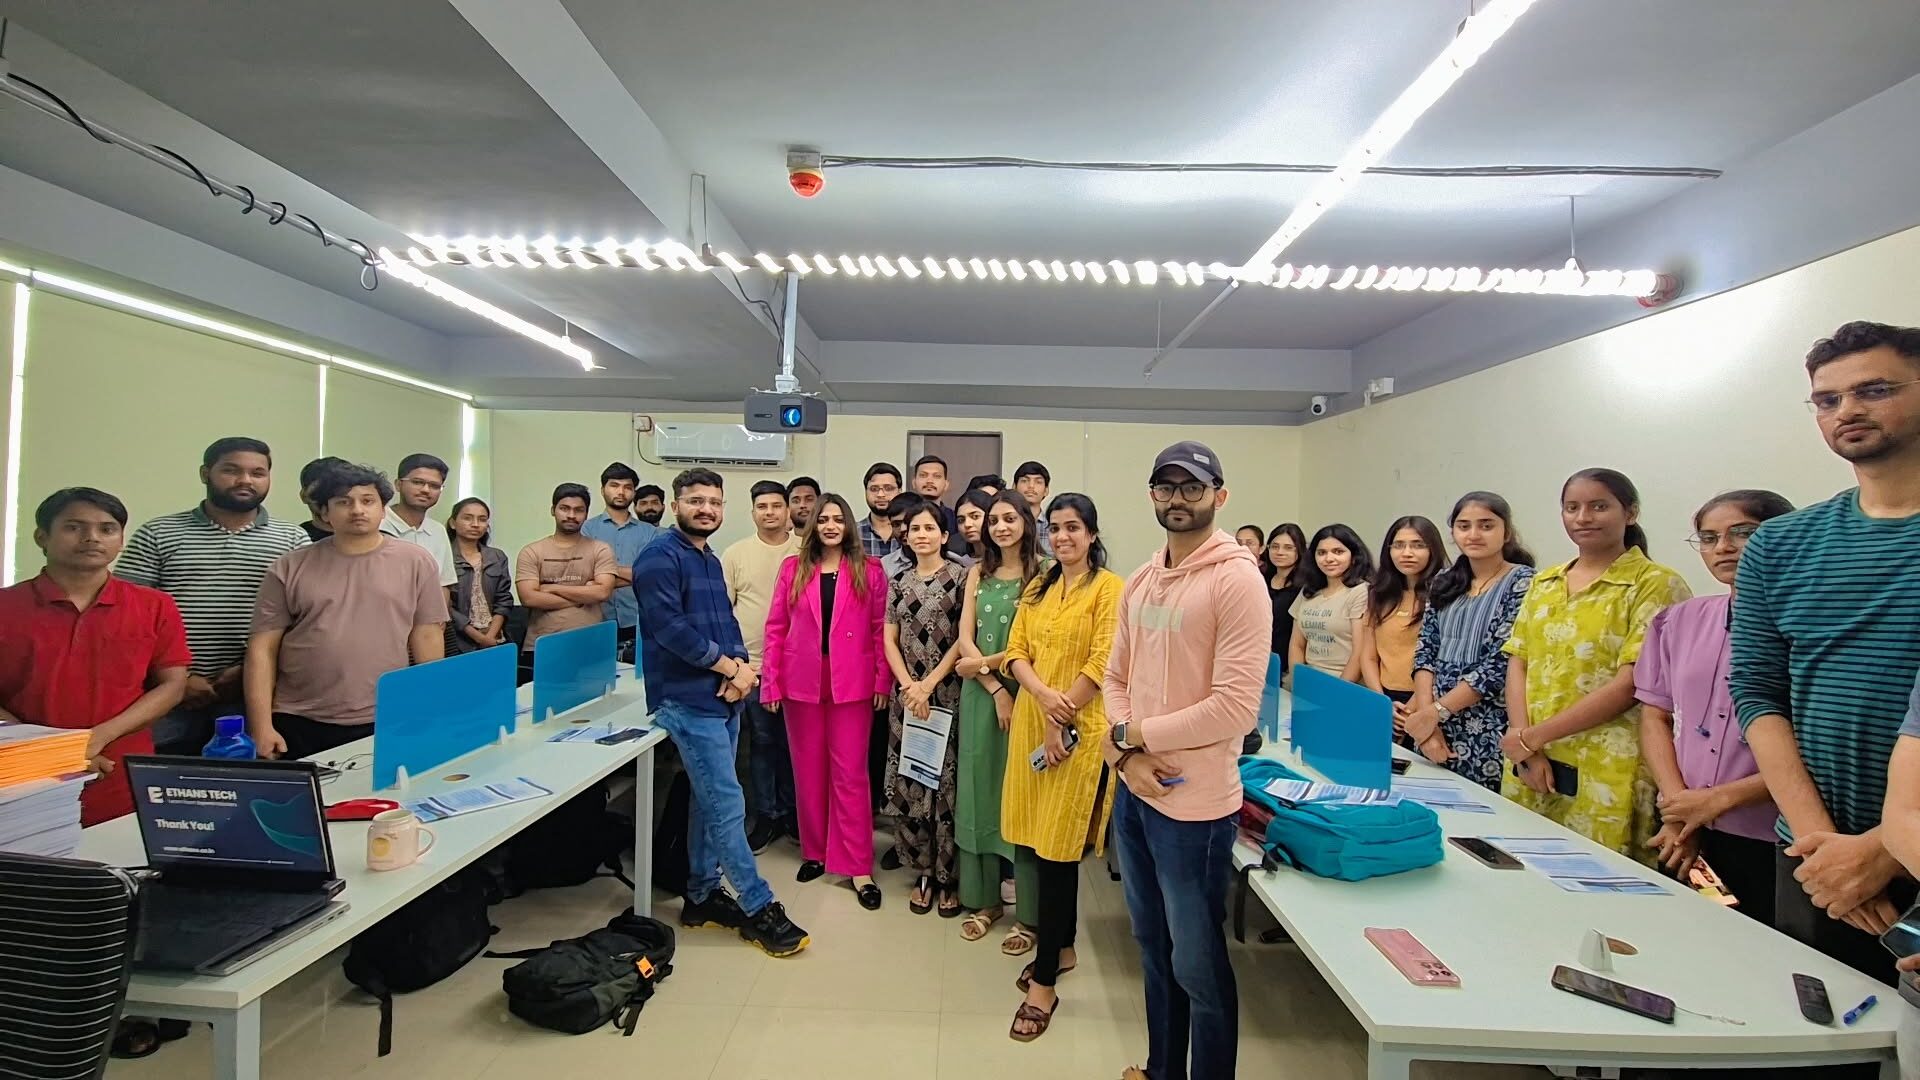
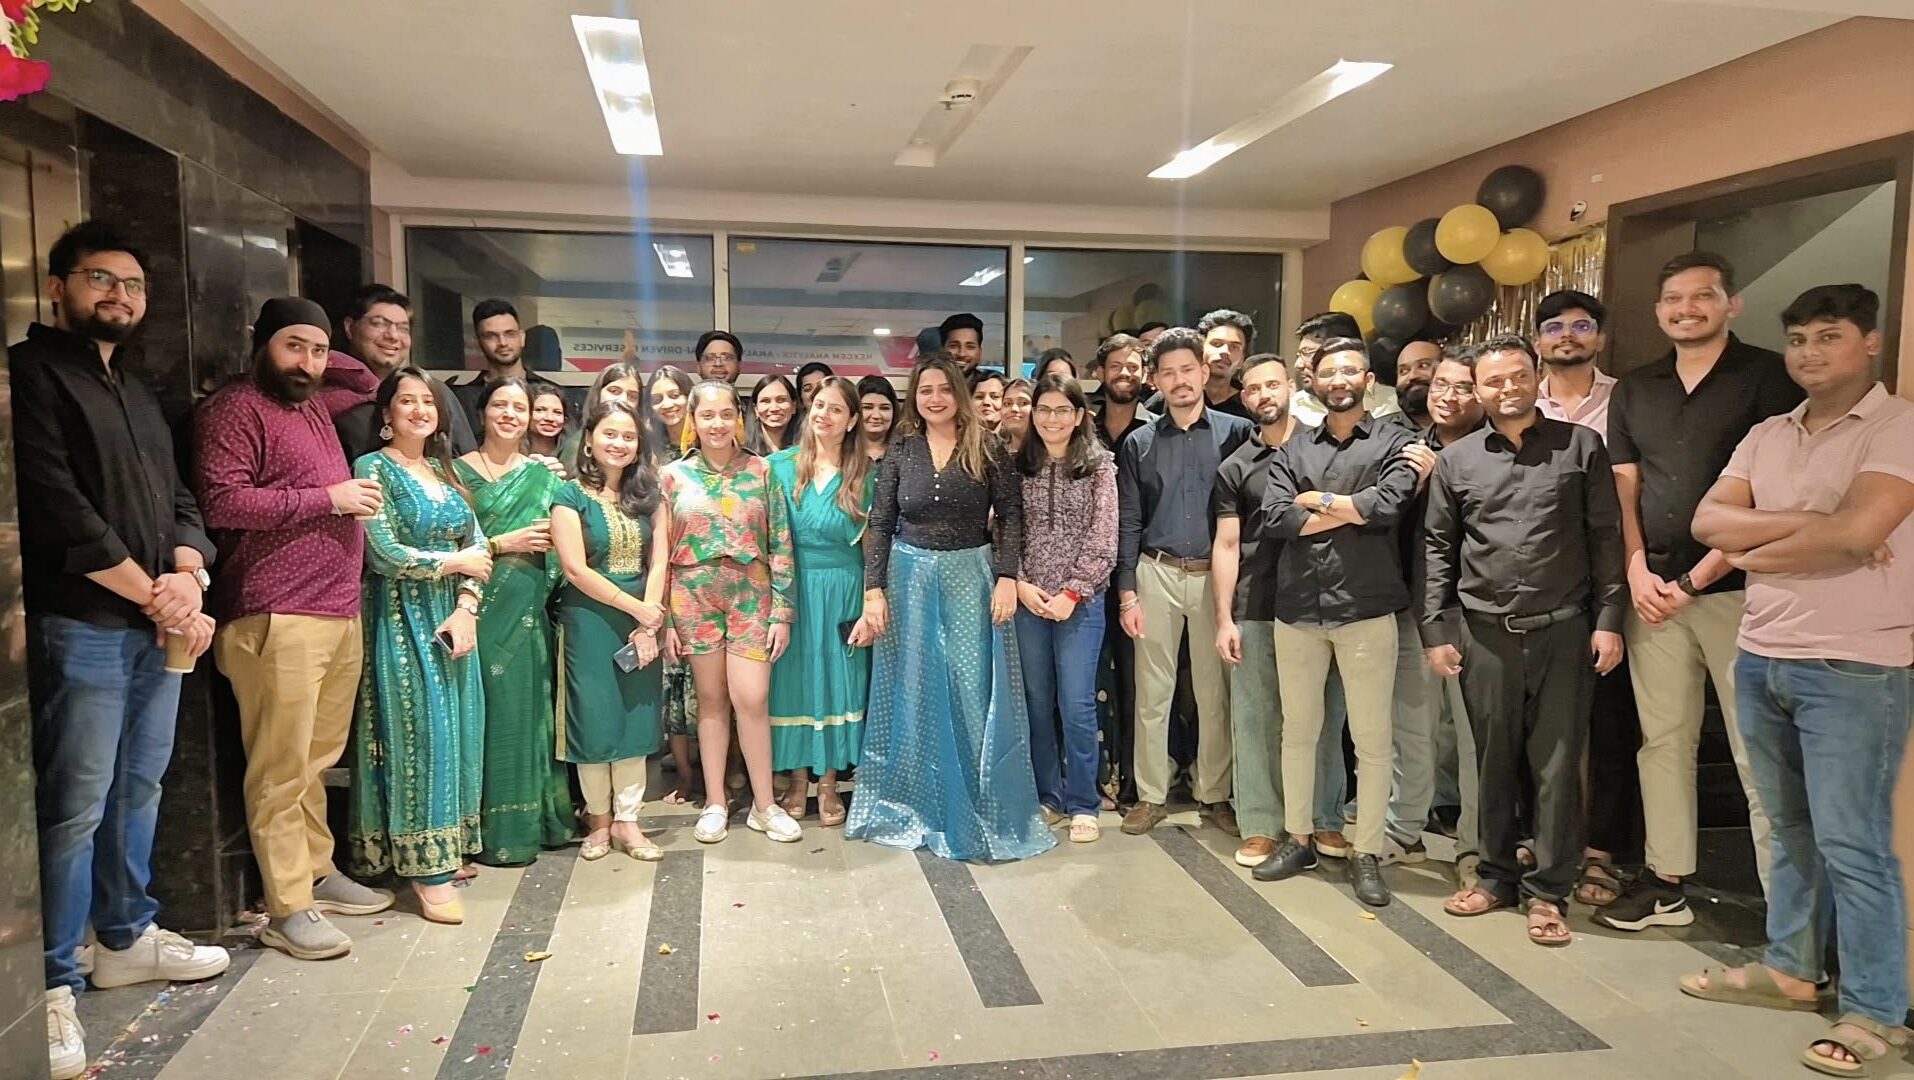
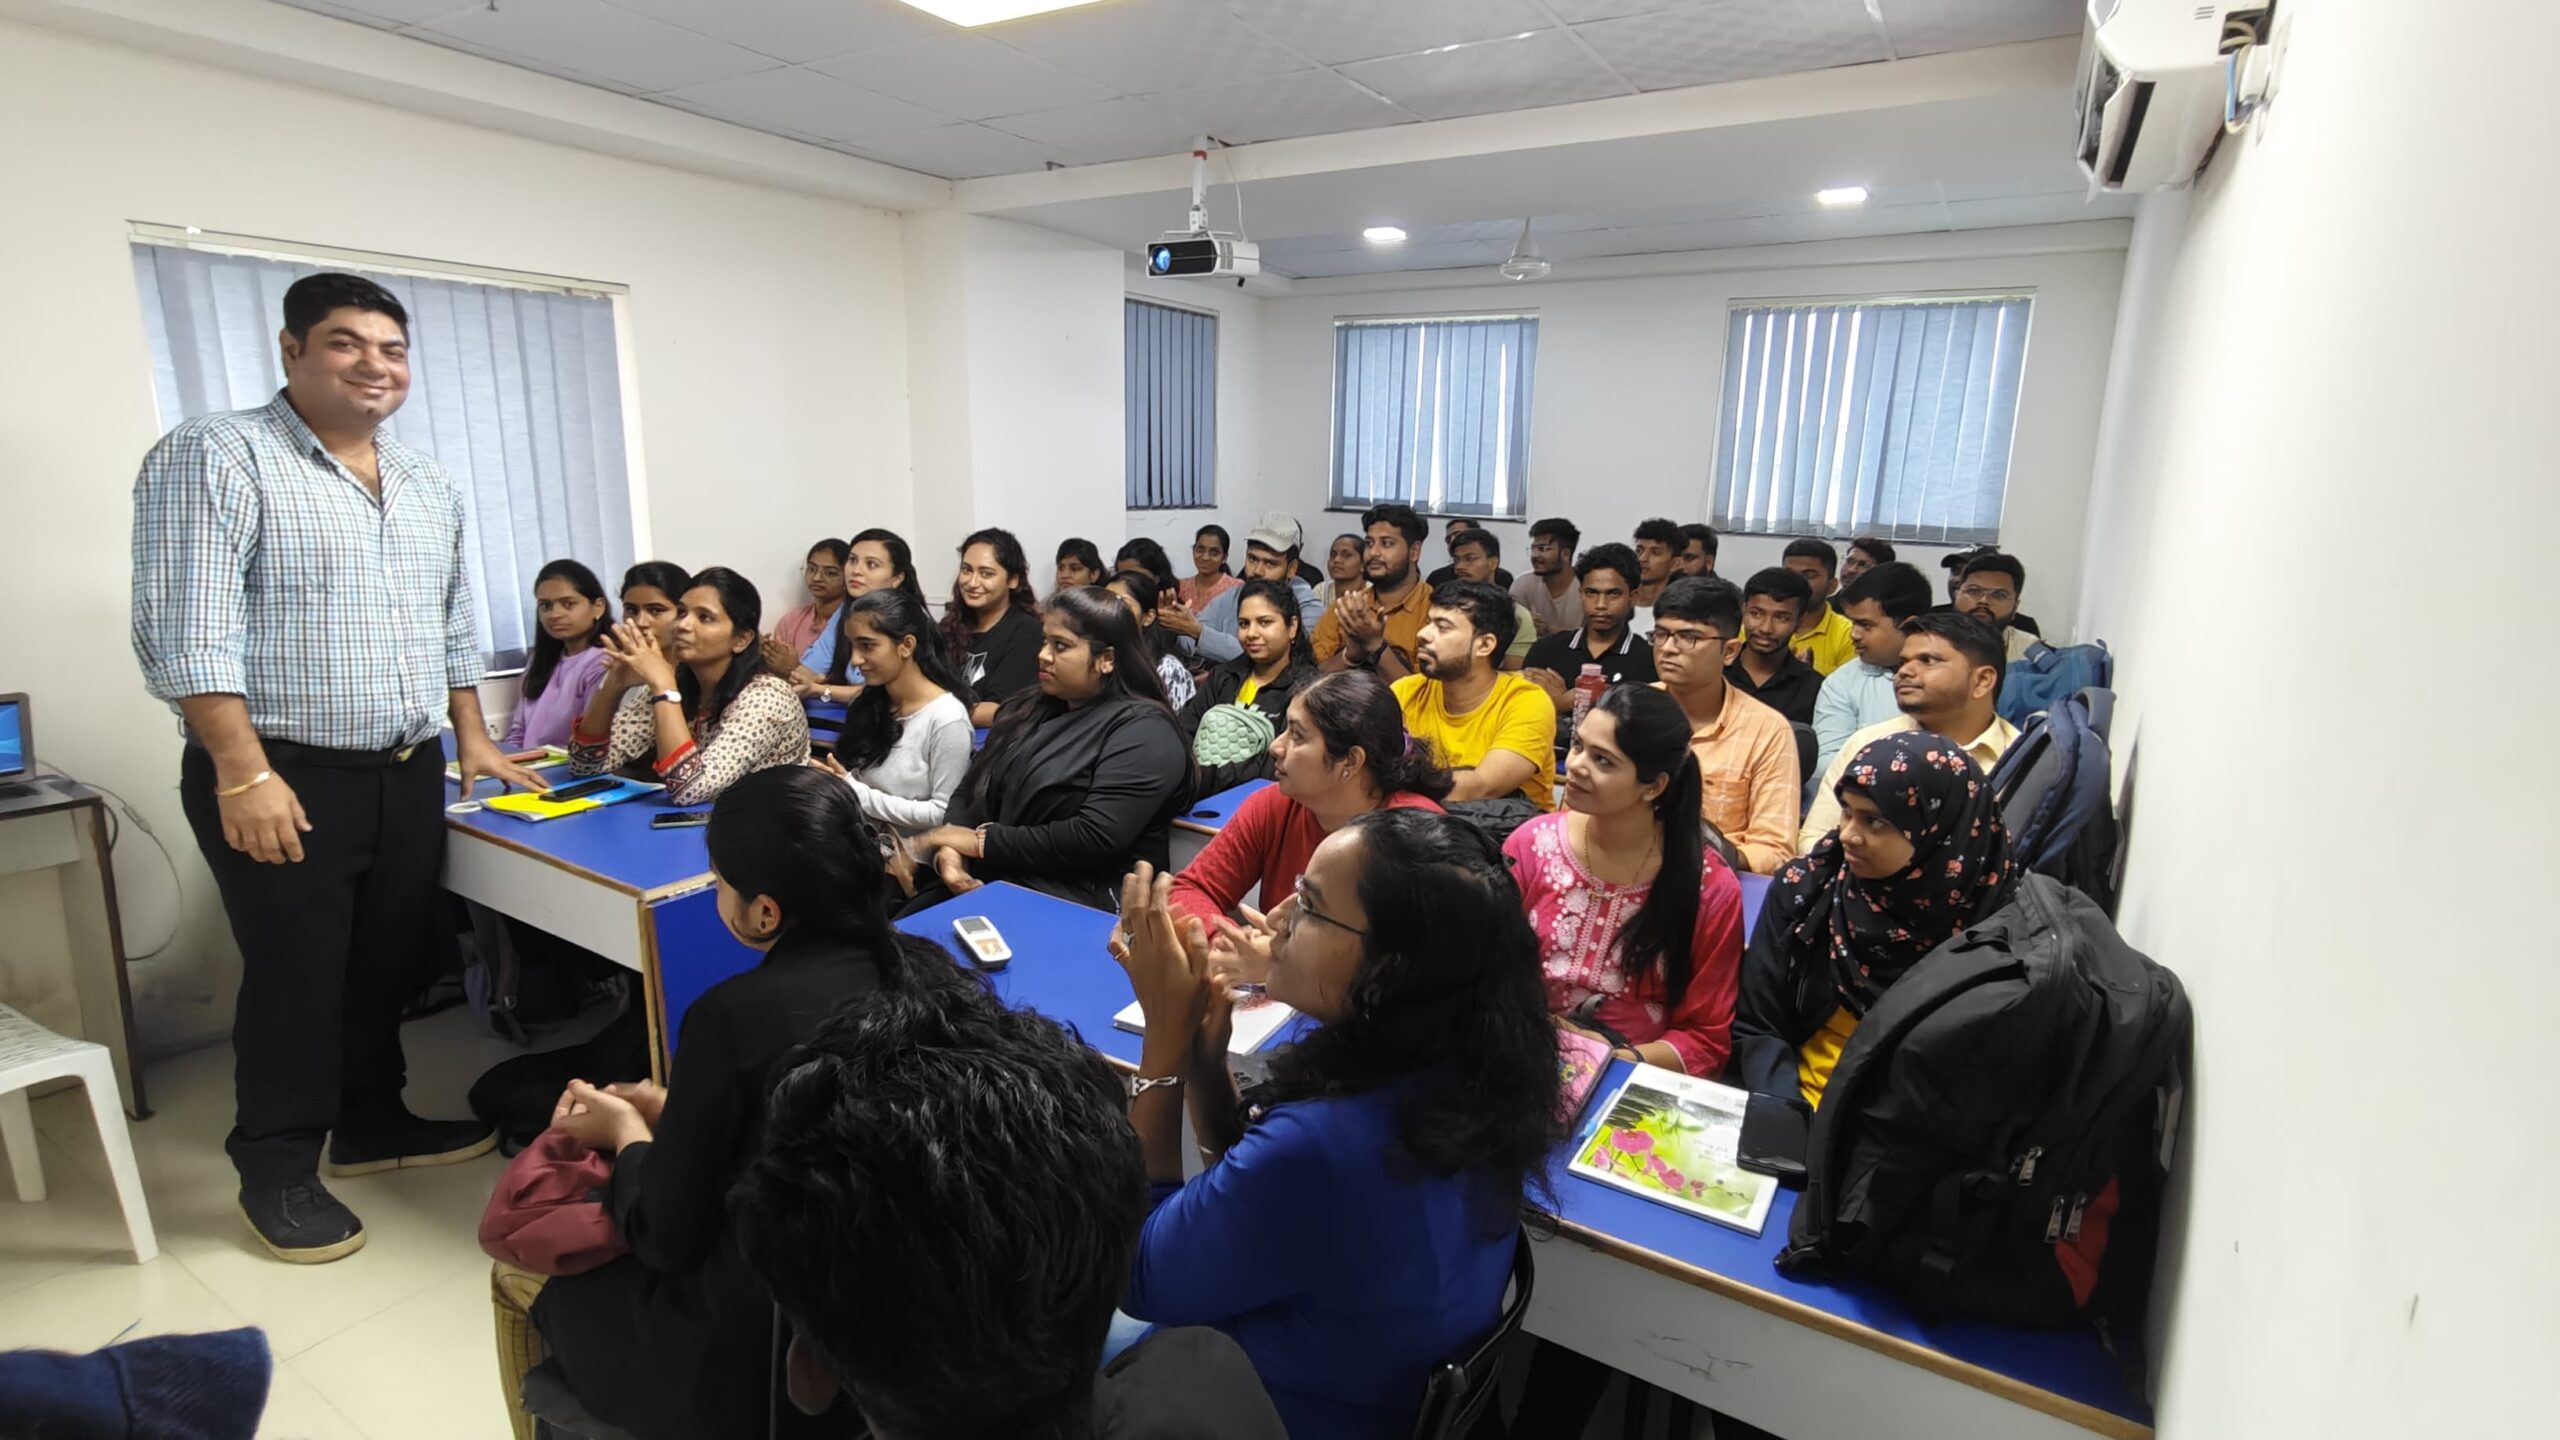
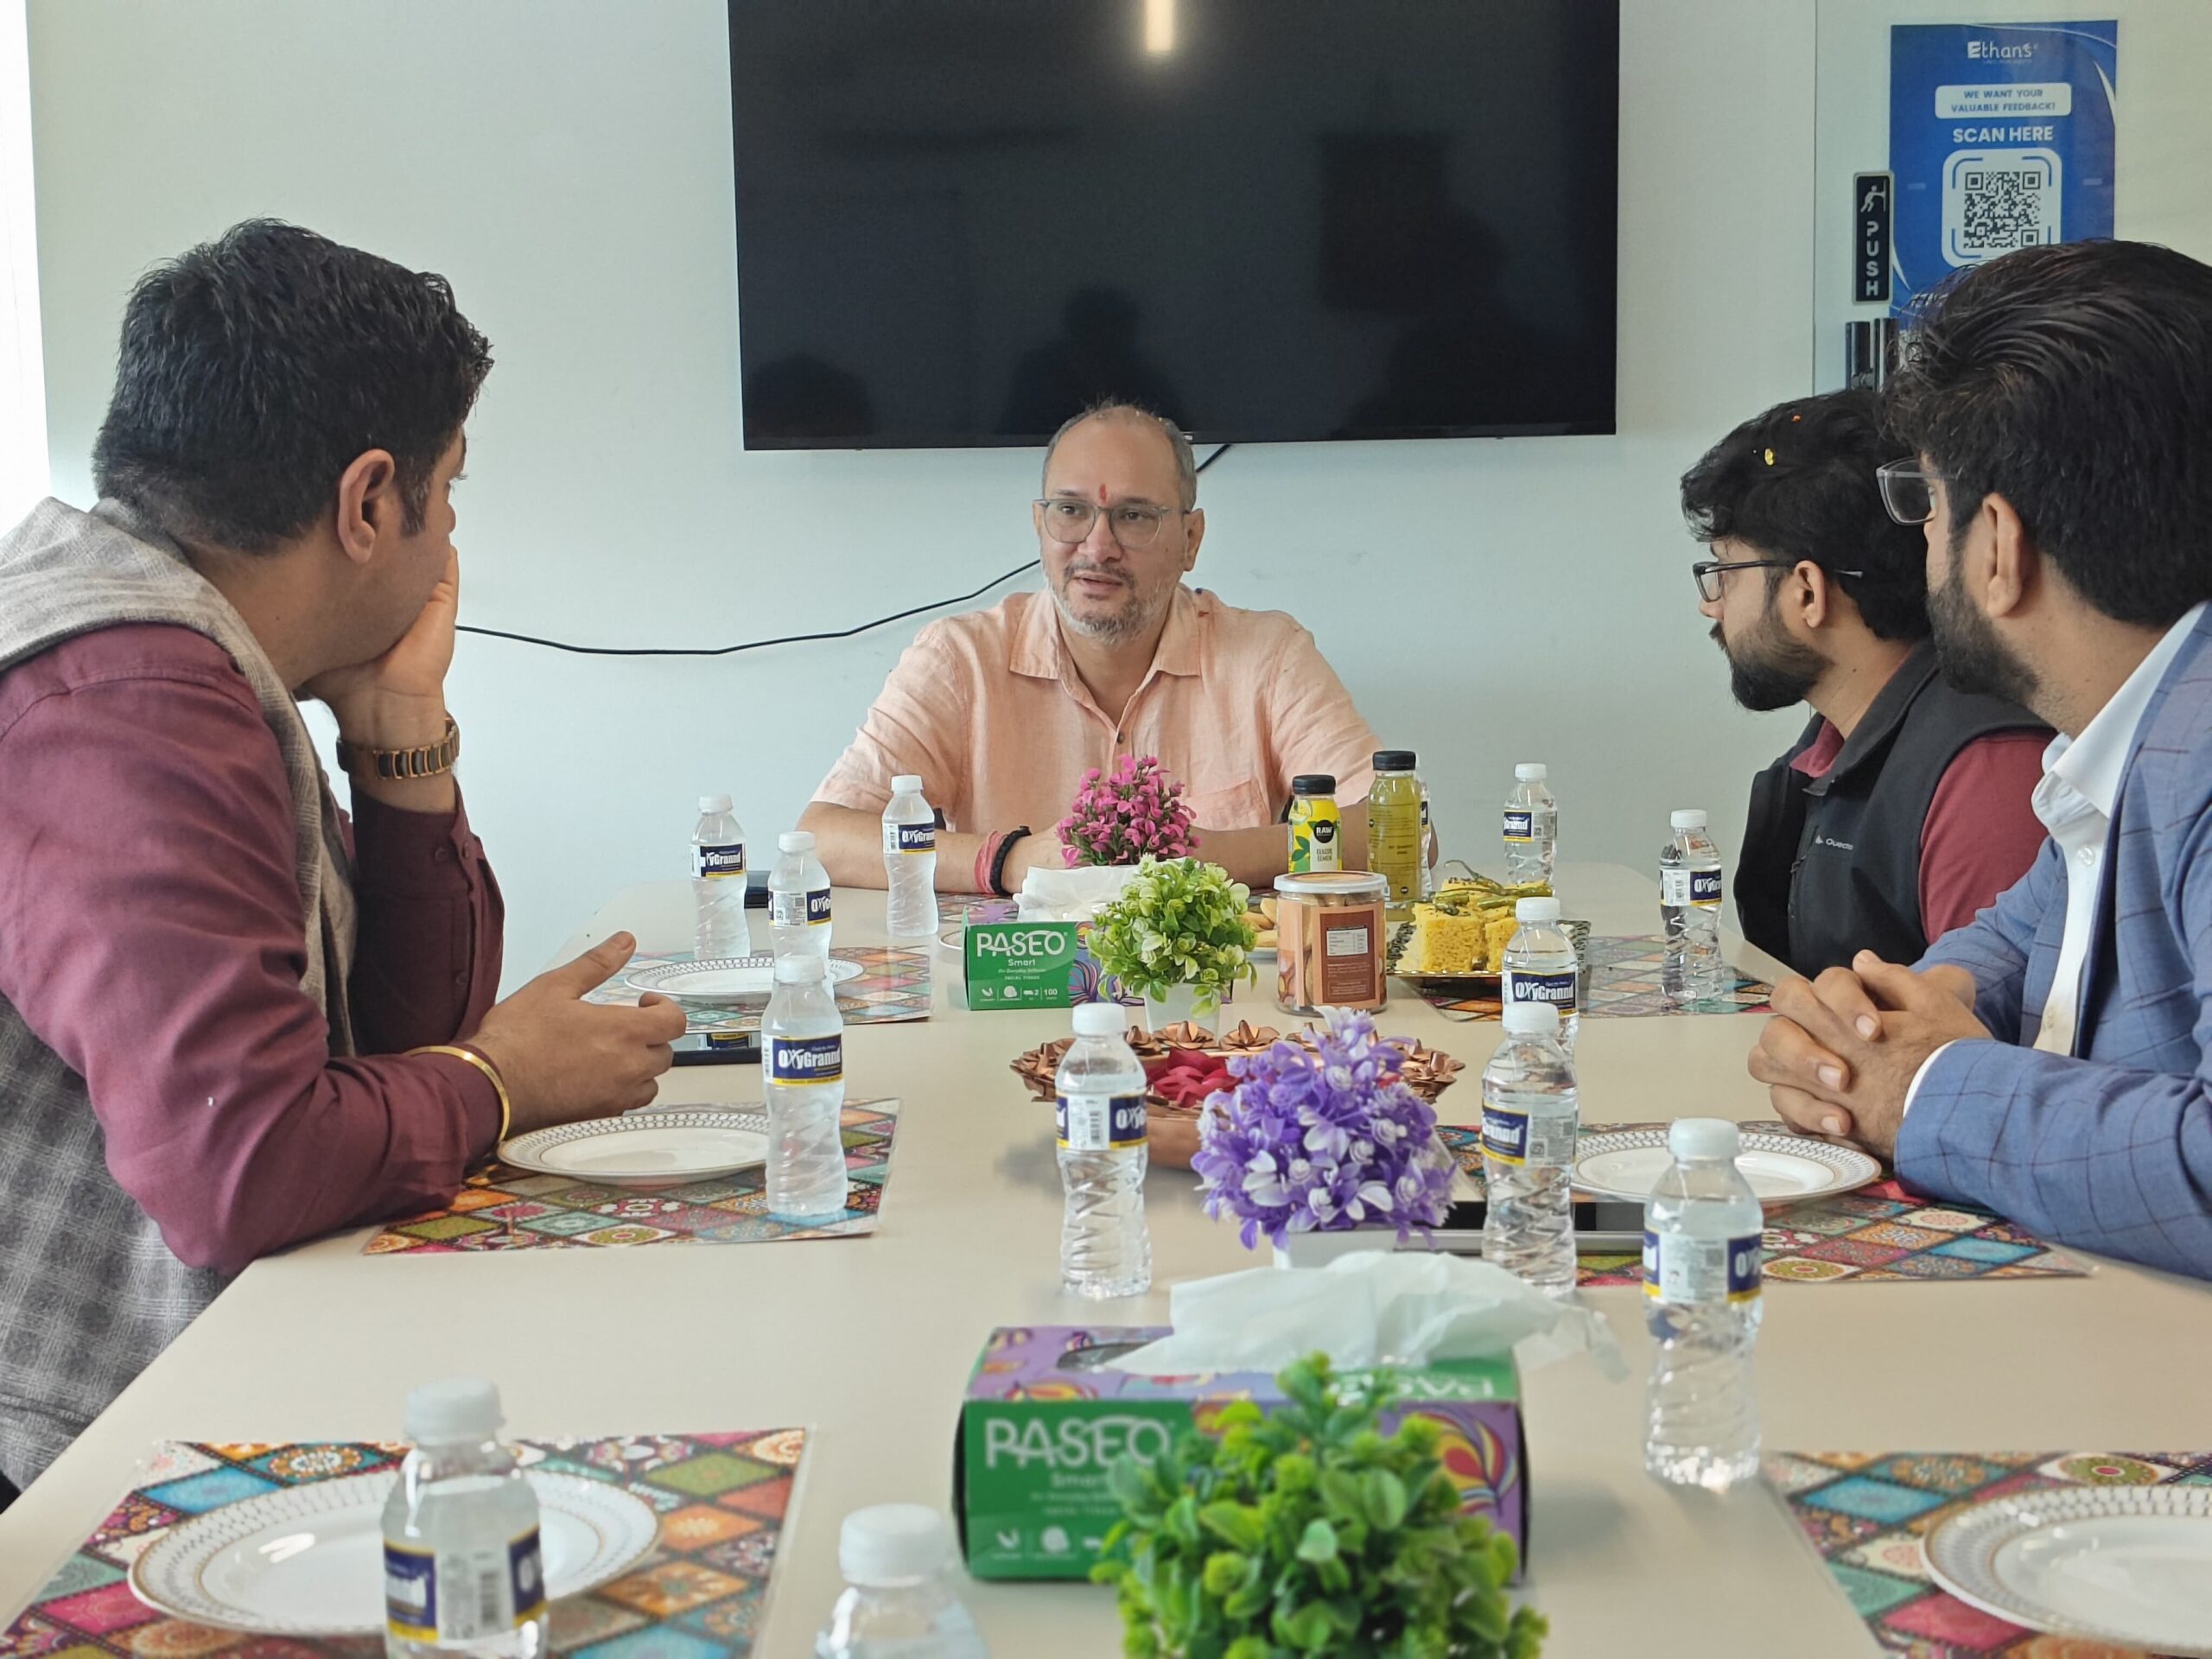
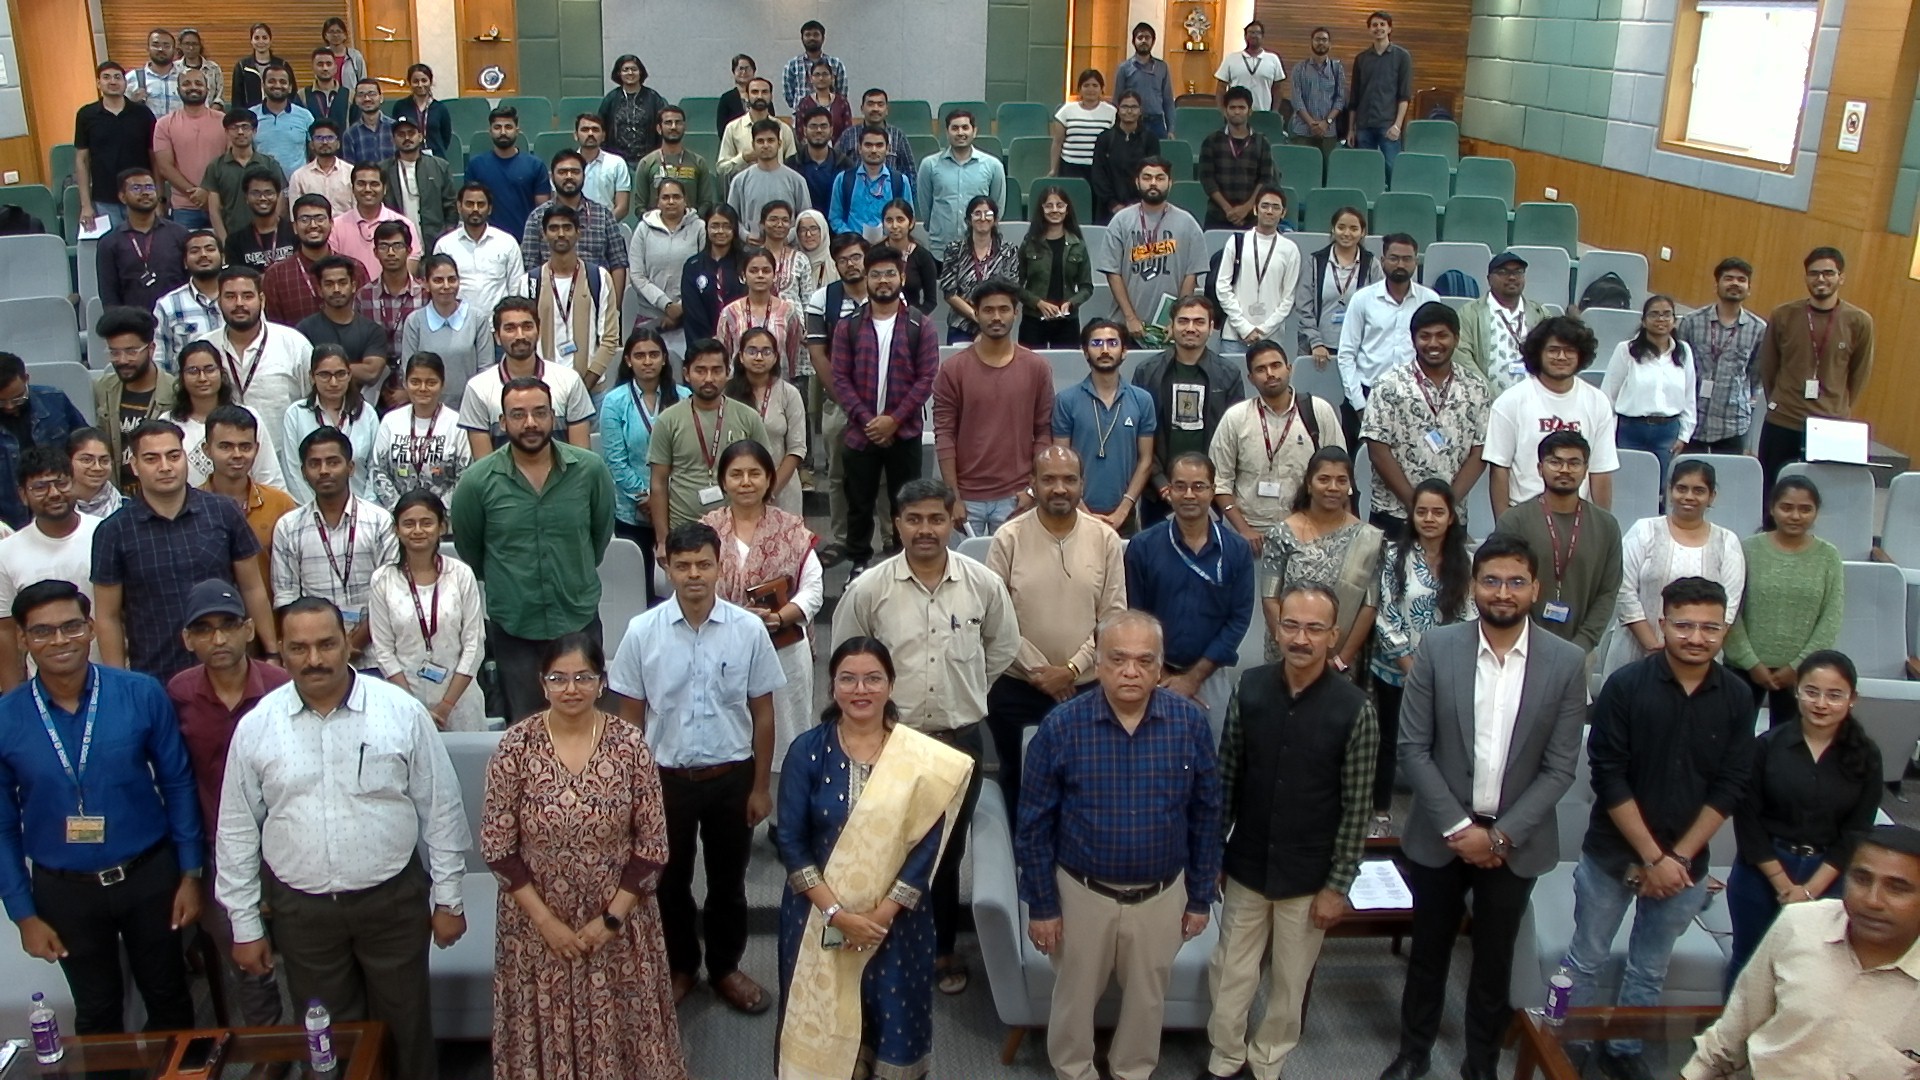
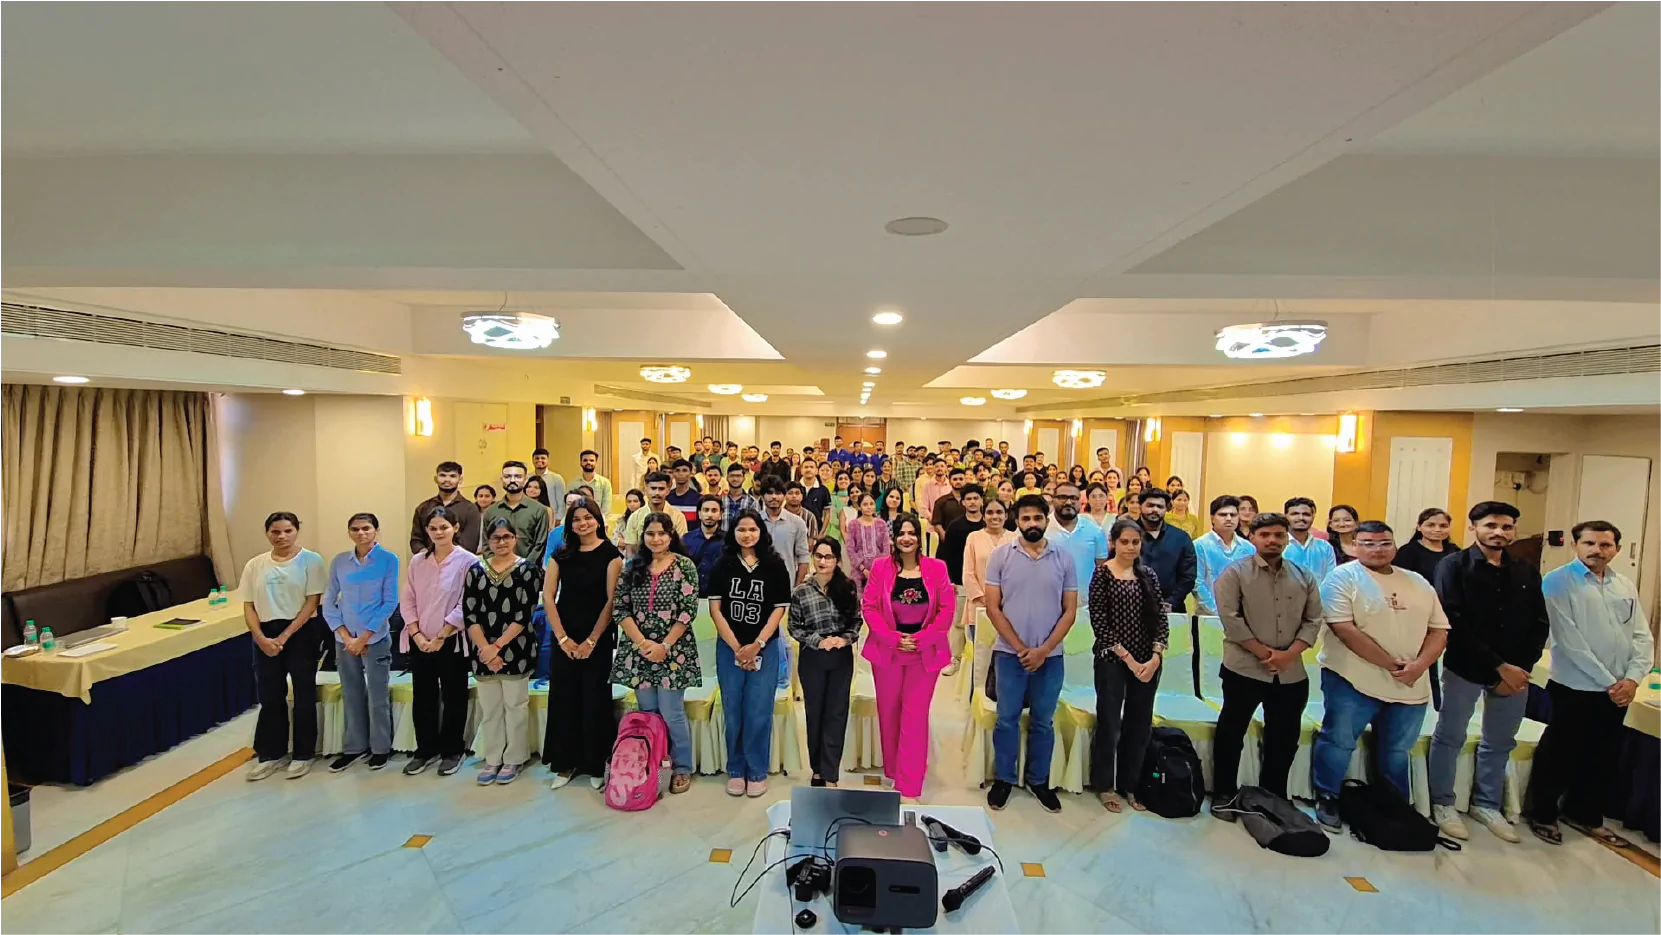
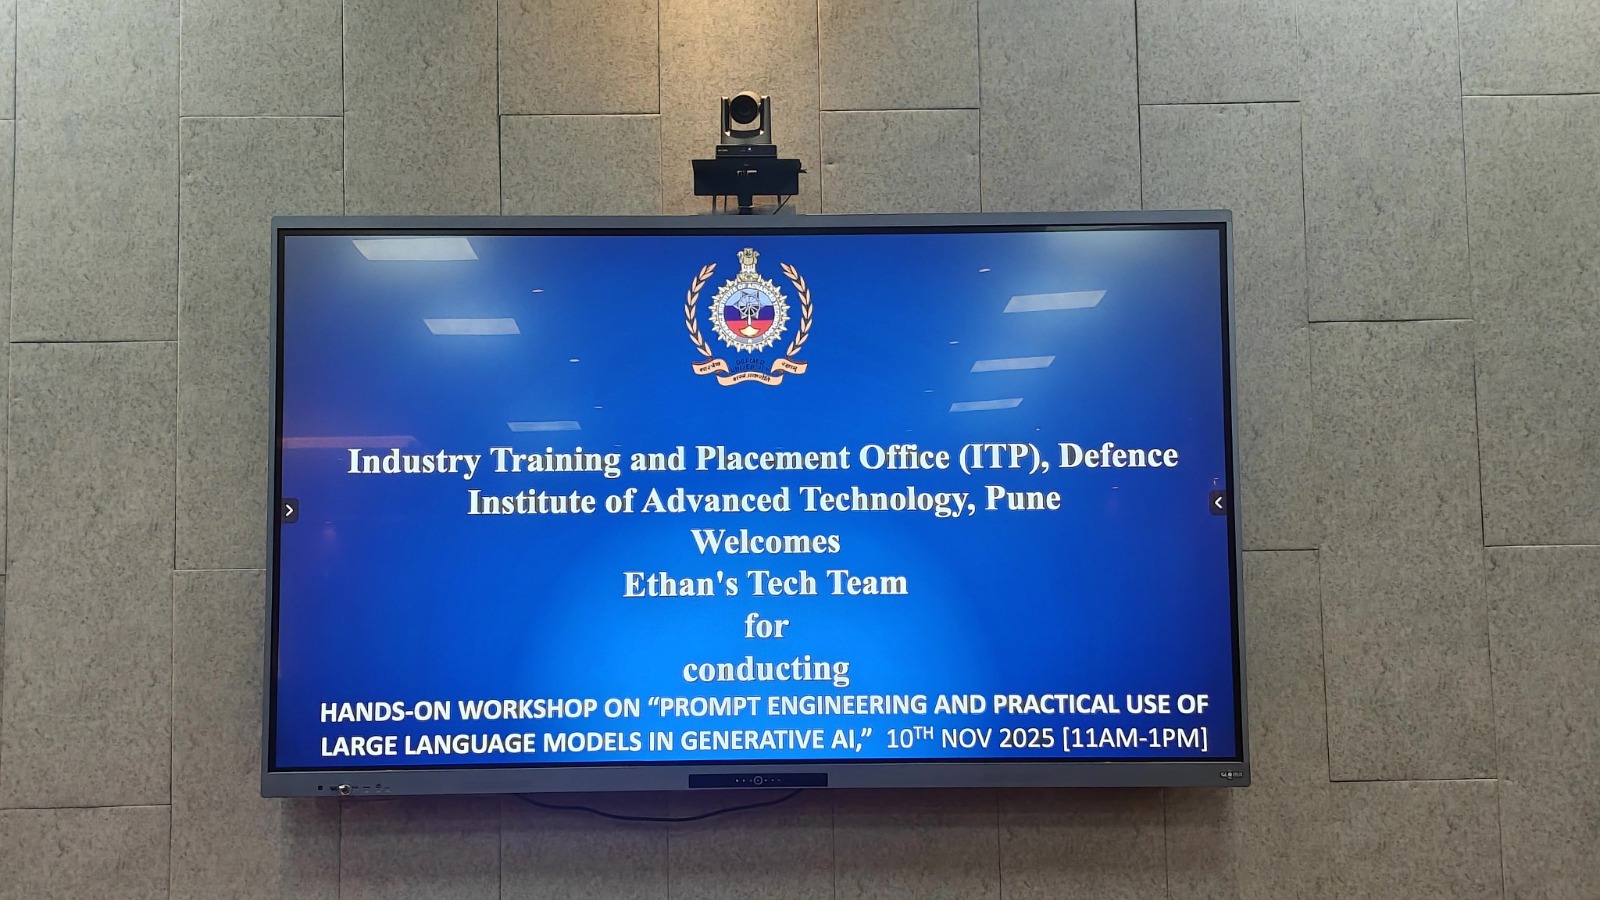
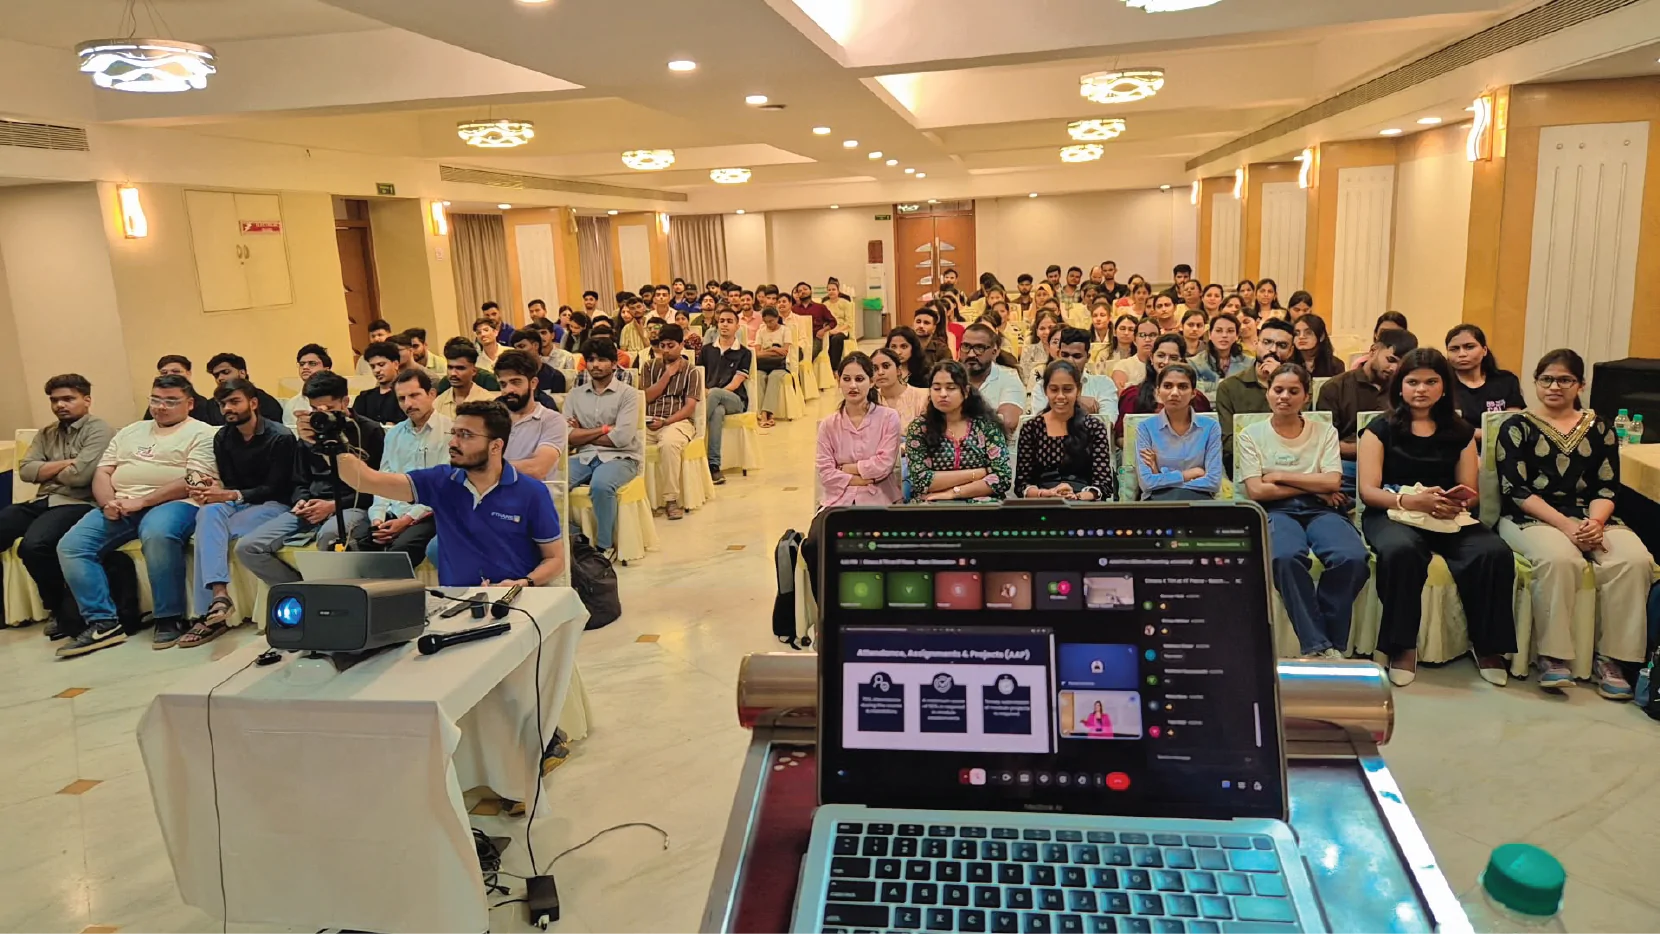
Ethan’s Office Tour
Ethans Tech is a leading professional training institute founded with the mission to bridge the gap between academic learning and real-world skills. With a strong presence in Pune and expanding across India, Ethans Tech has trained thousands of students and working professionals, helping them upgrade their careers in the most in-demand technologies.
The name “Ethans” represents a commitment to “education with excellence”. It’s not just a name; it’s a culture — built by passionate industry experts who believe in practical, hands-on learning rather than rote education. Every trainer at Ethan’s is a seasoned professional with real industry exposure, making the learning experience highly relevant, practical, and impactful.
At Ethans, it’s not just about completing a course — it’s about building a career.
Learners Profile
Our diverse and dynamic batch brings together individuals from various academic and professional backgrounds, creating a rich learning environment driven by collaboration and growth.
- 11% – College Graduates (Non-technical backgrounds)
- 23% – B.Tech & M.Tech Graduates (CS, IT, ME, CIVIL)
- 27% – BCA, B.Sc (IT/CS/Maths/Stats) Graduates
- 23% – Early Career Professionals (1–6 years of experience)
- 16% – Career Comeback Learners (with a gap in education or employment)
This blend of learners adds immense value to the learning experience — offering unique perspectives, fresh ideas, and real-world context to every session
Learner Profiles & Trusted Companies

Trusted By 155+ Top IT Companies For Upskilling
















Contact Us
Shivajinagar
1st Floor, Aone Capital, Office 101, 102, 103, Apte Rd, above Cafe Peter, Shivajinagar.
Let's Connect
We usually respond within few hours.
Phone Number
02248932060
Email Address
support@ethans.co.in
Request A Callback
Data Science & Analytics Certification Training FAQs
Who is this program meant for?
This program is designed for ambitious students, recent graduates, and working professionals who want to build expertise in Data Science, Data Analytics, and Artificial Intelligence. Whether you’re a student looking to gain industry-relevant skills before graduation, a graduate aiming to improve your employability and secure a role in the data industry, or a professional seeking to upskill, transition into data-driven roles, or stay ahead in an AI-powered workplace, this program provides the knowledge, practical experience, and hands-on projects needed to achieve your goals. With an industry-aligned curriculum, real-world case studies, expert mentorship, and career-focused learning, you’ll develop the confidence and skills required to succeed in today’s rapidly evolving data and AI ecosystem.
How are the classes scheduled?
To accommodate different learning preferences and schedules, we offer both Weekday and Weekend batches.
Weekday Batches: Ideal for learners who prefer a structured learning routine during the week.
Weekend Batches: Perfect for those who want to learn alongside their academic or professional commitments.
There is no restriction on who can join which batch. Students, recent graduates, and working professionals are free to enroll in either the Weekday or Weekend program based on their personal schedule, availability, and work-life balance.
Both batch formats deliver the same comprehensive curriculum, live instructor-led sessions, hands-on labs, real-world projects, mentorship, and career support. No matter which schedule you choose, you’ll receive the same high-quality learning experience and outcomes.
Can I repeat the classes if I miss or need a revision?
Is there a placement support system?
Do I need any prior coding knowledge?
No. This program is designed for beginners, so no prior coding, programming, or technical background is required to get started. Whether you’re a student from any academic discipline, a recent graduate, a working professional, or someone looking to transition into Data Science and AI, the curriculum is structured to help you learn from the ground up.
The program begins with the fundamentals of Python programming, SQL, statistics, Excel, and data analysis, ensuring you develop a strong conceptual and practical foundation before progressing to advanced topics such as data visualization, machine learning, generative AI, and real-world data science applications.
Our step-by-step learning approach combines live instructor-led sessions, hands-on labs, guided exercises, and industry projects, allowing you to build confidence as you learn. Dedicated mentors are available throughout the program to answer questions, clear doubts, and provide guidance, making the learning experience accessible even for learners with no prior technical experience.
By the end of the program, you’ll have gained practical skills, worked on real-world projects, and developed a portfolio that demonstrates your ability to apply Data Science and AI concepts in real business scenarios.
Will I receive any certification?
Yes. Upon successfully completing the program and meeting the required academic and project criteria, you will be eligible to receive multiple industry-recognized certifications, including:
- Certificate from TIH at IIT Bombay (for eligible programs).
- Certificate from TIH at IIT Patna (for eligible programs).
- FutureSkills Prime Certification to validate your industry-relevant skills.
- Course Completion Certificate from Ethan’s, recognizing your successful completion of the training program.
In addition, eligible learners may have the opportunity to undertake an internship with NexGen Analytix. Upon successful completion of the internship, participants will also receive an Internship Completion Certificate, providing valuable industry experience and strengthening their professional profile.
These certifications and industry exposure help demonstrate your skills, enhance your credibility, and add significant value to your resume and career progression.
Are there real-world projects included?
Yes. Practical learning is a core part of this program. Throughout the course, you’ll work on multiple real-world, industry-aligned projects that allow you to apply the concepts and tools you learn in class to solve real business problems.
As you progress, you’ll gain hands-on experience with real datasets, industry-standard tools, and end-to-end workflows used by data professionals. The program also includes a comprehensive capstone project, where you’ll integrate your knowledge to build a complete Data Science solution from data collection and analysis to model development and visualization.
These projects are designed to strengthen your practical skills, improve your problem-solving abilities, and help you build a professional portfolio that showcases your capabilities to recruiters and hiring managers. By the end of the program, you’ll have real project experience that prepares you for internships, job interviews, and roles in Data Science, Data Analytics, and AI.


